What is a Gantt chart?
Also called: Gantt diagram, project timeline, timeline view, bar chart schedule
A Gantt chart is a bar chart that shows a project's tasks against a calendar, with each bar marking when a task starts and ends and arrows showing which tasks depend on others.
A Gantt chart is a bar chart that shows a project’s tasks against a calendar. Each task is a horizontal bar: where the bar starts is when the task starts, how long it is shows how long the task takes, and where it ends is its due date. Read down the left side and you see what needs doing; read across the top and you see when. Lines between bars show which tasks must finish before others can begin.
In short, a Gantt chart turns a to-do list into a timeline, so you can see the whole project at a glance and spot clashes before they happen.
Why a Gantt chart matters for a small business
Small projects still have moving parts: a website launch needs copy before design, design before build, and the client’s sign-off before anything goes live. A list of tasks does not show how they depend on each other. A Gantt chart does.
- Realistic deadlines. Laying tasks end to end shows whether the date you promised the client is possible.
- Early warnings. If one task slips, you can see every task it pushes back.
- Clear conversations. A timeline is easier for clients and teammates to understand than a spreadsheet.
- Better use of people. You can see when two tasks for the same person overlap.
How a Gantt chart works: an example
Tunde, a freelance designer in Lagos, is building a new website for a bakery over four weeks. His Gantt chart looks like this:
| Task | Starts | Takes | Depends on |
|---|---|---|---|
| Kick-off and brief | Week 1, Monday | 2 days | Nothing |
| Copywriting | Week 1, Wednesday | 5 days | Brief |
| Design mock-ups | Week 2, Wednesday | 5 days | Copy |
| Client approval (milestone) | Week 3, Wednesday | 0 days | Mock-ups |
| Build pages | Week 3, Wednesday | 6 days | Approval |
| Launch (milestone) | Week 4, Friday | 0 days | Build |
When the bakery takes an extra three days to approve the designs, Tunde drags the approval diamond along, the build bar moves with it, and he can see at once that launch slips to the following Wednesday. He tells the client that day, not on launch day.
Key parts of a Gantt chart
- Task list: the rows, usually grouped into phases.
- Timeline: the columns, in days, weeks or months.
- Bars: one per task, showing start, length and end.
- Dependencies: arrows linking tasks, most often “this one cannot start until that one finishes”.
- Milestones: diamond markers for key moments with no length of their own, such as “client approves design”. See project milestone.
- Today line: a vertical line showing where you are now.
- Progress: shading inside a bar to show how much is done.
- Critical path: the chain of dependent tasks that sets the end date. Any delay on it delays the whole project.
Best practices and common mistakes
- Do not plan every hour. For a small project, tasks of one day to two weeks are about right. Tiny tasks make the chart unreadable.
- Add the waiting time. Client feedback, printing and payment clearing take time too. Put them on the chart.
- Update it. A Gantt chart drawn on day one and never touched is fiction by week two. Move bars as reality changes.
- Show it to the people involved. A timeline only helps if the team and the client see it. Walk through it at the kick-off, agree the dates that depend on them, such as when they will send content or give feedback, and point back to it when something moves.
- Keep dependencies honest. Link only tasks that truly must wait. Too many links make everything look critical.
- Know when you do not need one. For ongoing work with no fixed end, such as support requests, a kanban board often suits better.
If you are planning your first project, our project plan template gives you the task list to start from, and the guide to project management for beginners explains the rest of the process.
Related terms
A project milestone is a checkpoint shown as a diamond on the chart. A kanban board shows the same tasks by status instead of by date. Project management software usually draws the Gantt chart for you from task dates.
Gantt charts in startbuddi
Every project in Work has a Timeline tab that works as a Gantt chart. Bars come from each task’s start and due dates, milestones show as diamonds, a Today line marks the date, and you can zoom by day, week or month. Dependency arrows link tasks, and a critical path highlight shows the chain that sets your end date.
You can drag a bar to move it, drag its ends to change its length, or drag its dot onto another task to make that task wait for it. When you move a task that others depend on, startbuddi asks whether to move only that task or the ones after it too. On a phone, the timeline becomes a dated list.
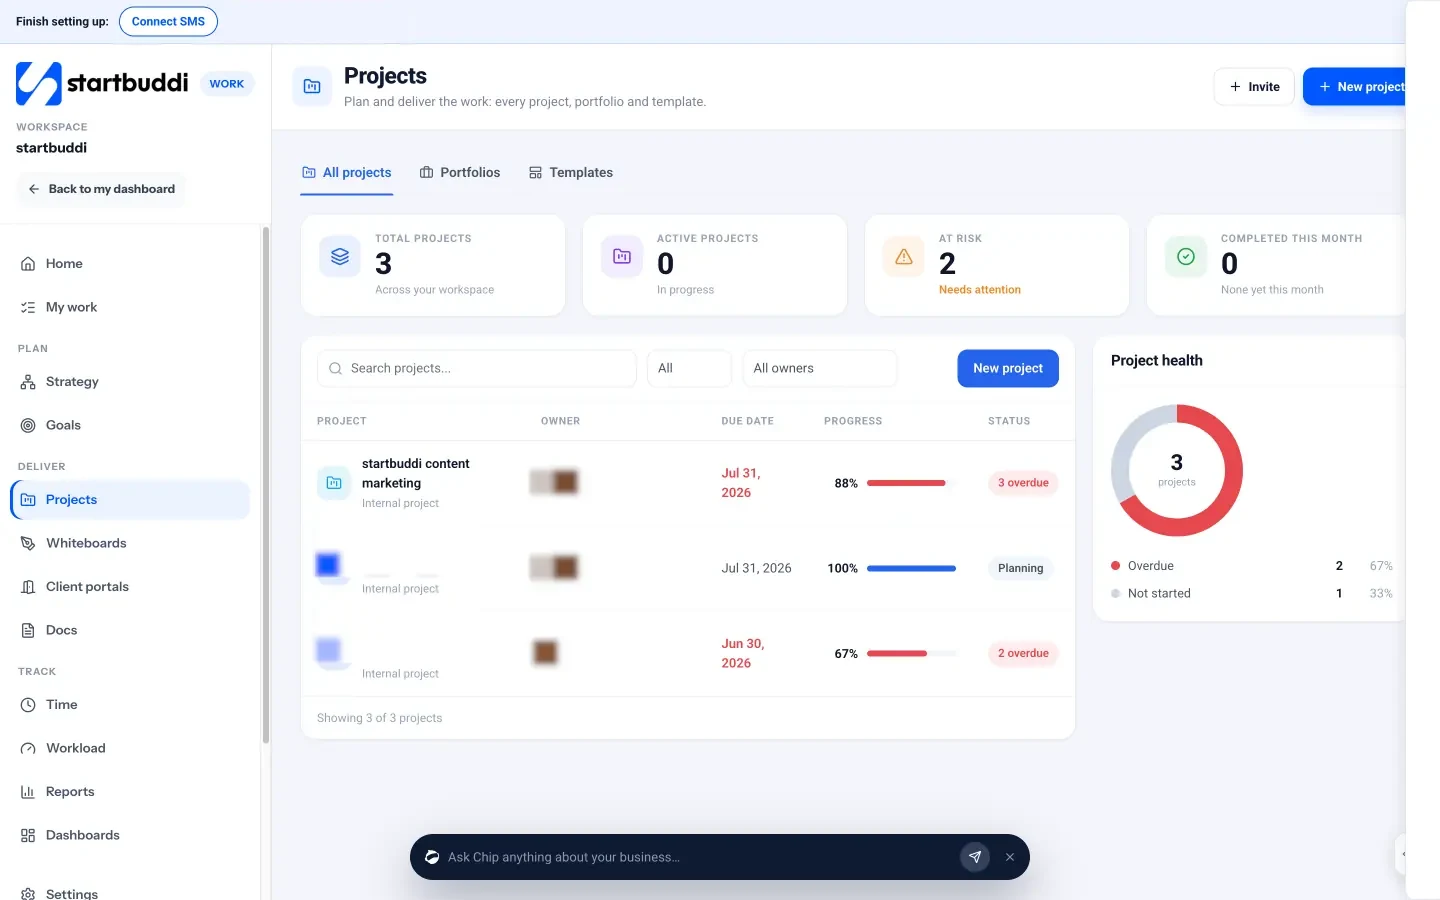
Your next step: open one live project, give each task a start and due date, and look at the Timeline to see if your deadline still holds.
Related terms
FAQ
What is a Gantt chart used for?
It is used to plan and track a project over time: when each task starts and ends, which tasks depend on others, and whether the deadline still holds.
What is the difference between a Gantt chart and a timeline?
A simple timeline shows events in date order. A Gantt chart adds a bar for each task's length, dependencies between tasks and usually progress.
Can I make a Gantt chart in a spreadsheet?
Yes, by shading cells under date columns. It works for small projects, but you have to move everything by hand when dates change.
Is a Gantt chart agile?
Gantt charts come from traditional planning, where the full plan is set up front. Agile teams tend to prefer boards and sprints, though many teams use both.
Tiwalade Joanna Okedara-Kalu is the founder, CEO and CTO of startbuddi, the business system that brings clients, bookings, invoices, projects, marketing and the Chip AI assistant into one place. Tiwalade builds software around how service businesses really work day to day, and writes about client management, getting paid on time and why small businesses outgrow the tools they start with.
Founded startbuddi and leads its product and engineering