7 small business KPIs every owner should track
The seven small business KPIs that matter most, from cash runway to repeat customers, with simple formulas, examples and a 30-minute monthly review.


- Track seven numbers every month: cash runway, monthly revenue, gross margin, money owed and days to pay, new leads, conversion rate and repeat customer rate. Write them down on the same day, compare with last month, and take one action on the number that moved the wrong way.
Small business KPIs (key performance indicators) are the handful of numbers that tell you, at a glance, whether the business is healthy and heading the right way. You don’t need a dashboard of fifty metrics. Seven numbers cover almost everything: cash in the bank, monthly revenue, gross profit margin, money owed to you, new leads, conversion rate and repeat customers. Check them on the same day every month, write them down, and act on the one that moved the wrong way.
This guide explains each of the seven, how to calculate it with simple maths, what “good” looks like, and what to do when a number goes the wrong way.
Why a few KPIs beat a big dashboard
Numbers only help if you look at them and change something as a result. A founder who checks seven numbers every month will make better decisions than one who owns a beautiful dashboard and never opens it. Small businesses rarely fail for lack of data. They fail because a warning sign was there for months and nobody was watching it.
New businesses have little room for error. In the United States, figures from the Bureau of Labor Statistics show that for establishments opened in 2022, first-year survival ranged from about 74% to 78% depending on the region, so roughly one in four closed within a year. The numbers below are the early warning system that helps you avoid becoming one of them.
A good KPI has three qualities:
- You can measure it easily, ideally from records you already keep.
- It changes what you do. If a number moving up or down wouldn’t change any decision, drop it.
- You compare it over time. One month on its own means little. The trend tells the story.
If you are also setting goals, KPIs and OKRs work together. Our explainer on OKR vs KPI covers the difference.
The 7 small business KPIs at a glance
| KPI | The question it answers | How to work it out |
|---|---|---|
| 1. Cash runway | How long can I keep going? | Cash in the bank ÷ average monthly spending |
| 2. Monthly revenue | How much money came in? | Total paid by customers this month |
| 3. Gross profit margin | How much of each sale do I keep? | (Revenue − direct costs) ÷ revenue × 100 |
| 4. Money owed and days to pay | Who owes me, and how slow are they? | Total unpaid invoices, and average days from invoice to payment |
| 5. New leads | Are enough people interested? | New enquiries this month |
| 6. Conversion rate | How many enquiries become customers? | New customers ÷ new leads × 100 |
| 7. Repeat customer rate | Do people come back? | Customers who bought again ÷ all customers × 100 |
1. Cash runway
Cash runway is how many months you could keep running if no more money came in. It is the most important number for a young business, because profit on paper doesn’t pay rent. Cash does.
How to work it out: take the cash you have available for the business and divide it by your average monthly spending over the last three months. If you have ₦3,000,000 and spend ₦750,000 a month, your runway is four months.
What good looks like: a runway that grows over time. Set yourself a floor, such as three months of costs, and treat dropping below it as a signal to act. If yours is shrinking month after month, move early: chase unpaid invoices, pause spending you can live without, or bring in a quick sale. Our guide to cash flow management covers the tactics.
2. Monthly revenue
Revenue is the money customers actually paid you in the month. Use cash received, not invoices sent, so the number reflects reality.
How to read it: compare each month with the month before and the same month last year if you have it. Many businesses are seasonal, so December against November can mislead you. Look at the three-month average to smooth out the bumps.
Go one level deeper: split revenue by what you sell or where it came from. You may find that one service brings in most of your money, or that one client makes up half of it. That second one is a risk worth noting.
3. Gross profit margin
Revenue tells you how much came in. Gross margin tells you how much of it you kept after the direct costs of delivering what you sold, such as materials, stock, subcontractors or delivery.
How to work it out: (revenue − direct costs) ÷ revenue × 100. If a catering job brings in ₦500,000 and the food, staff for the day and transport cost ₦300,000, the gross margin is 40%.
Why it matters: a business with rising revenue and a falling margin is working harder for less. Common causes are discounting, rising supplier prices you haven’t passed on, or jobs that take longer than you priced for. Try our free profit margin calculator to check your own numbers, and see our guide on how to price your services if the margin is too thin.
4. Money owed to you and average days to pay
Every unpaid invoice is your money sitting in someone else’s account. Track two numbers: the total you are owed (and how much of it is overdue), and the average number of days customers take to pay after you invoice them.
How to work it out: for each invoice paid this month, count the days between sending it and being paid, then take the average. If your terms are 14 days and customers take 38, you have a collection problem, not a sales problem.
What to do: send invoices the day the work is done, make paying easy with a pay-now button, send polite reminders before and after the due date, and take deposits on bigger jobs. Our guide to handling late payments has scripts you can use.
5. New leads
A lead is anyone who shows real interest: a form filled in, a booking request, a WhatsApp enquiry, a referral. It is the earliest sign of future revenue. If leads drop this month, revenue will usually drop a month or two later.
How to track it: count new enquiries each month and note where each came from. After a few months you will see which channels are worth your time. If Instagram brings 40 enquiries but referrals bring 10 that almost all buy, both numbers matter.
Related number: if you spend money on marketing, divide that spend by the number of new customers it brought in. That is your cost to win a customer, and it should be well below what a customer is worth to you.
6. Conversion rate
Conversion rate is the share of leads who become paying customers. It tells you how good you are at turning interest into sales.
How to work it out: new customers this month ÷ new leads this month × 100. If 50 people enquired and 10 bought, your conversion rate is 20%. For longer sales, where people take weeks to decide, use a three-month window so the numbers line up.
How to improve it: reply faster, follow up more than once, send clear quotes with a simple way to say yes, and make sure your prices and process are easy to understand. A simple pipeline, where you can see every open deal and what stage it is at, makes it obvious where people drop off.
Read it with leads: conversion and leads work as a pair. If leads rise but conversion falls, the new enquiries may be the wrong fit, or you may be too busy to follow up properly. If leads fall but conversion rises, your marketing may have narrowed to better-fit people, which can be a good trade. Looking at both together stops you fixing the wrong problem.
7. Repeat customer rate
Winning a new customer takes time and money. Keeping one usually costs far less. A Harvard Business Review article on the value of keeping the right customers cites research by Frederick Reichheld of Bain and Company showing that a 5% increase in customer retention can raise profits by 25% to 95%.
How to work it out: customers who bought from you more than once in the last 12 months ÷ all customers in that period × 100. For subscription or retainer businesses, track the opposite too: how many customers cancelled this month.
How to improve it: check in after each job, ask for feedback, remind people when it is time to rebook, and give regulars a reason to come back. If you have customers who have gone quiet, our guide on winning back lost customers shows how to reach out.
How to run a monthly numbers review
Pick one day each month, such as the first Monday, and block 30 minutes. Then:
- Write the seven numbers down in the same place every month, so you can see the trend.
- Mark each one as better, worse or about the same as last month.
- Pick the one that worries you most. Just one.
- Decide one action to move it this month, with a date. For example: “Call every client with an invoice more than 30 days overdue by Friday.”
- Next month, check the action first, then the numbers.
If you have a partner or small team, do the review together. Sharing the numbers builds trust and gets everyone thinking about the same problem.
What your review sheet can look like
Here is an example for a fictional small design studio. Three months side by side are enough to spot a trend.
| KPI | July | August | September | Trend |
|---|---|---|---|---|
| Cash runway | 4.0 months | 3.6 months | 3.1 months | Worse |
| Revenue | ₦1.8m | ₦2.1m | ₦2.2m | Better |
| Gross margin | 52% | 47% | 44% | Worse |
| Average days to pay | 21 | 29 | 36 | Worse |
| New leads | 18 | 22 | 25 | Better |
| Conversion rate | 28% | 27% | 28% | Same |
| Repeat customers | 40% | 41% | 41% | Same |
Revenue and leads look great, yet runway is falling. The sheet shows why: customers are paying later and margin is slipping. The one action for October is clear: chase the slow payers and review the prices on the jobs that ran over.
Mistakes to avoid
- Tracking too much. Start with these seven. Add more only when you have a question they can’t answer.
- Counting invoices as cash. Revenue you haven’t collected can’t pay bills.
- Checking once and stopping. The value is in the monthly habit.
- Chasing vanity numbers. Followers and page likes feel good, but leads and paying customers pay the bills.
How startbuddi tracks your KPIs for you
Most of these numbers come from records you already keep in startbuddi, such as invoices, payments, contacts and deals, so you don’t need to rebuild them in a spreadsheet each month.
Analytics: every number in one place
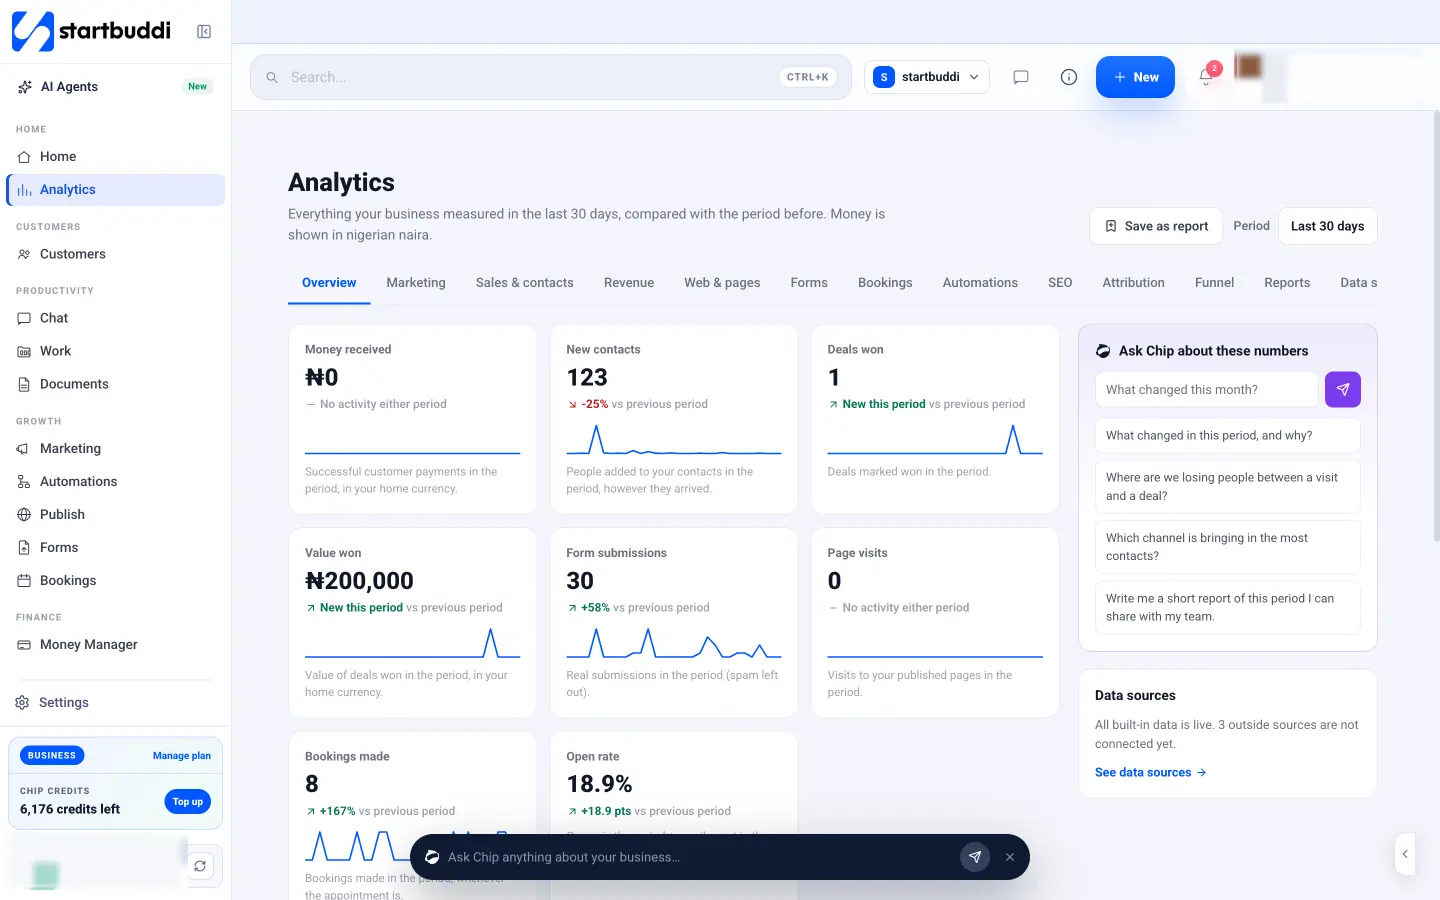
Analytics brings together money received, new contacts, deals won, value won, form submissions, page visits, bookings and email open rate, and compares each one with the period before in plain words. The Sales and contacts tab shows your win rate, and the Attribution tab shows where new contacts and won deals came from. Save any view as a report to check each month, or ask Chip what changed and why.
Money: cash, margin and who owes you
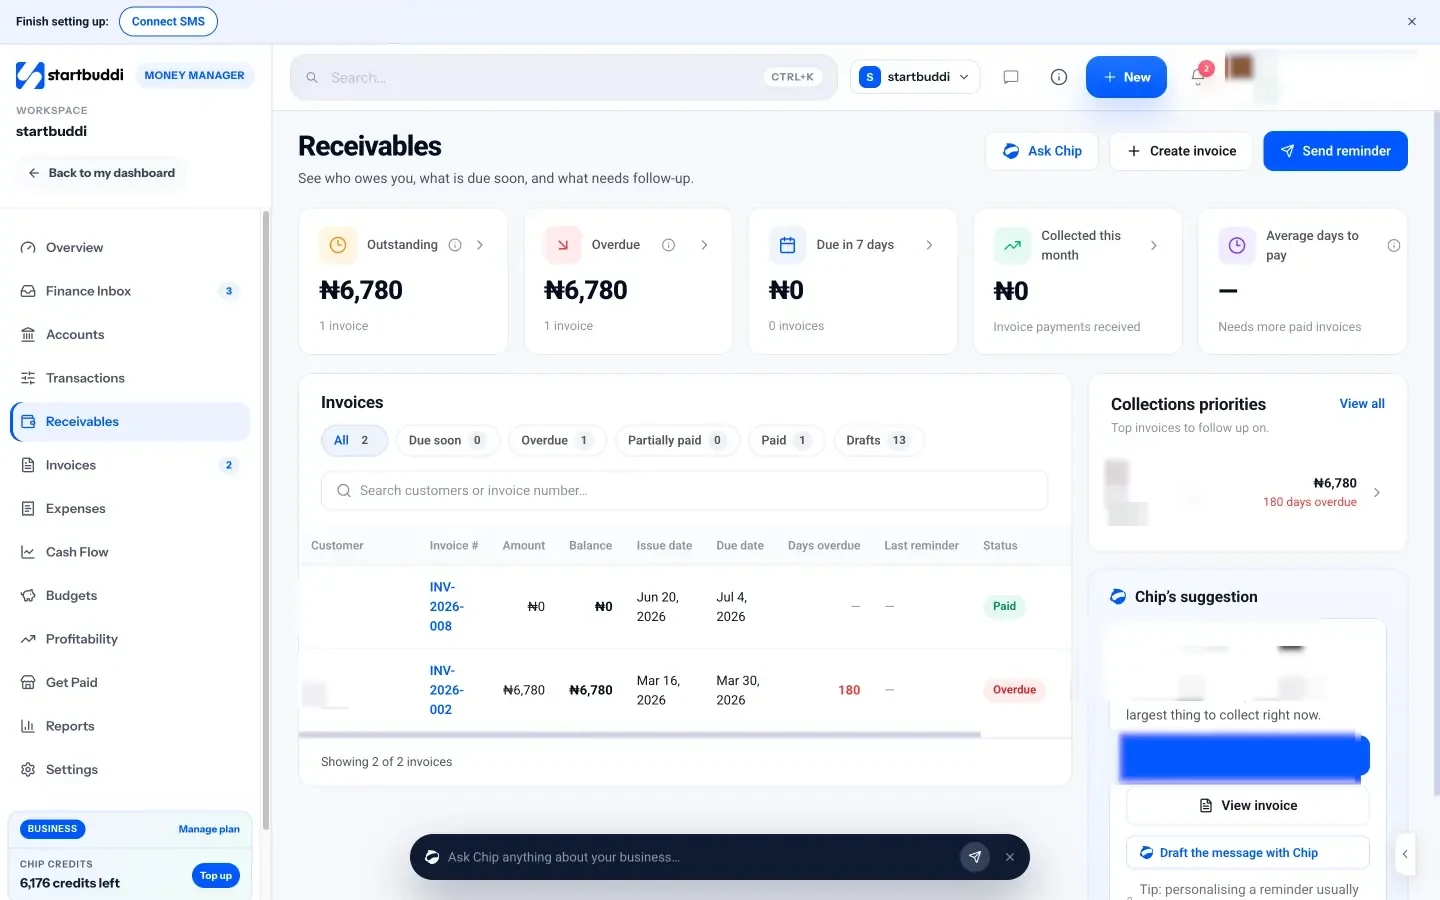
The Money Manager overview shows money in, money out, what is outstanding, and an estimated balance in 30 days built from open invoices, subscriptions and recurring costs. Receivables shows what is overdue, what is due in the next 7 days and your average days to pay, with a one-click reminder for each open invoice.
For margin, the profitability view shows revenue, expenses, profit and margin by customer, project, product or campaign, so you can see who and what actually makes you money.
Leads and conversion
The sales pipeline shows every open deal by stage, so you can see where leads stall. Contacts record where each person came from, which feeds the attribution view in Analytics.
Goals for the numbers that matter most
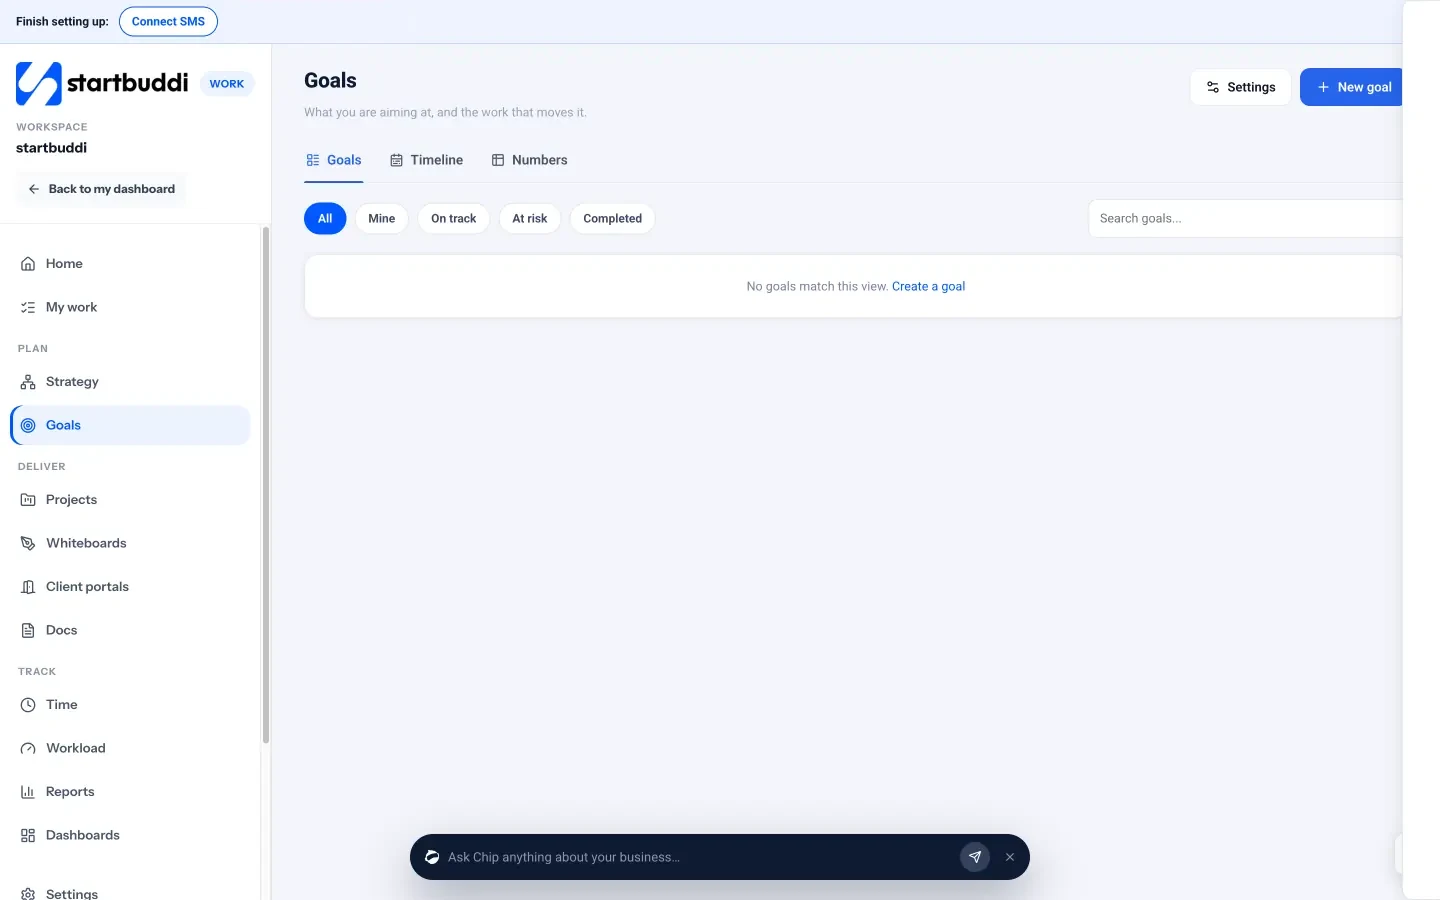
When one KPI needs attention, turn it into a goal in Goals, with a target, an owner and weekly check-ins, and link the tasks that will move it.
Your next step
Open a blank page today and write down your seven numbers for last month, even if some are rough estimates. That first list is your baseline. Put a 30-minute review in your calendar for the first Monday of next month and do it again. When you want the numbers to gather themselves from your invoices, contacts and deals, you can explore Analytics in startbuddi, or compare plans on the pricing page.
Sources
- US Bureau of Labor Statistics: 1-year survival rates for new business establishments by year and location (2024)
- Harvard Business Review: The value of keeping the right customers (2014)
Frequently asked questions
How many KPIs should a small business track?
Start with five to seven. Add more only when you have a question these numbers can't answer.
How often should I review my KPIs?
Monthly for most businesses. Check cash more often, weekly if your runway is under three months.
What is the most important KPI for a new business?
Cash runway, because it tells you how long you can keep going while you build sales.
What is the difference between revenue and profit?
Revenue is what customers pay you. Profit is what is left after your costs. A business can grow revenue and still lose money.
Chinedu Kalu is the co-founder and chief operating officer of startbuddi, responsible for how the company runs day to day. Chinedu writes about the operational side of a small business: registering and running the company, money, hiring and the routines that keep a team on track.
Co-founded startbuddi and runs its operations