The problem
If you run a service business, you probably answer two kinds of “how is it going?” questions. One is your own: are enquiries up, is money coming in, did last month’s campaign do anything? The other comes from clients: what did we get for the work, and can you send me something I can show my boss?
Both used to mean digging. Some numbers sat in Marketing, some in Publish, some in Money Manager, and the ones from your website lived in Google Analytics and Search Console. A client report meant screenshots pasted into a document, rewritten every month by hand, and checked twice because one wrong figure undoes the whole thing.
What’s new
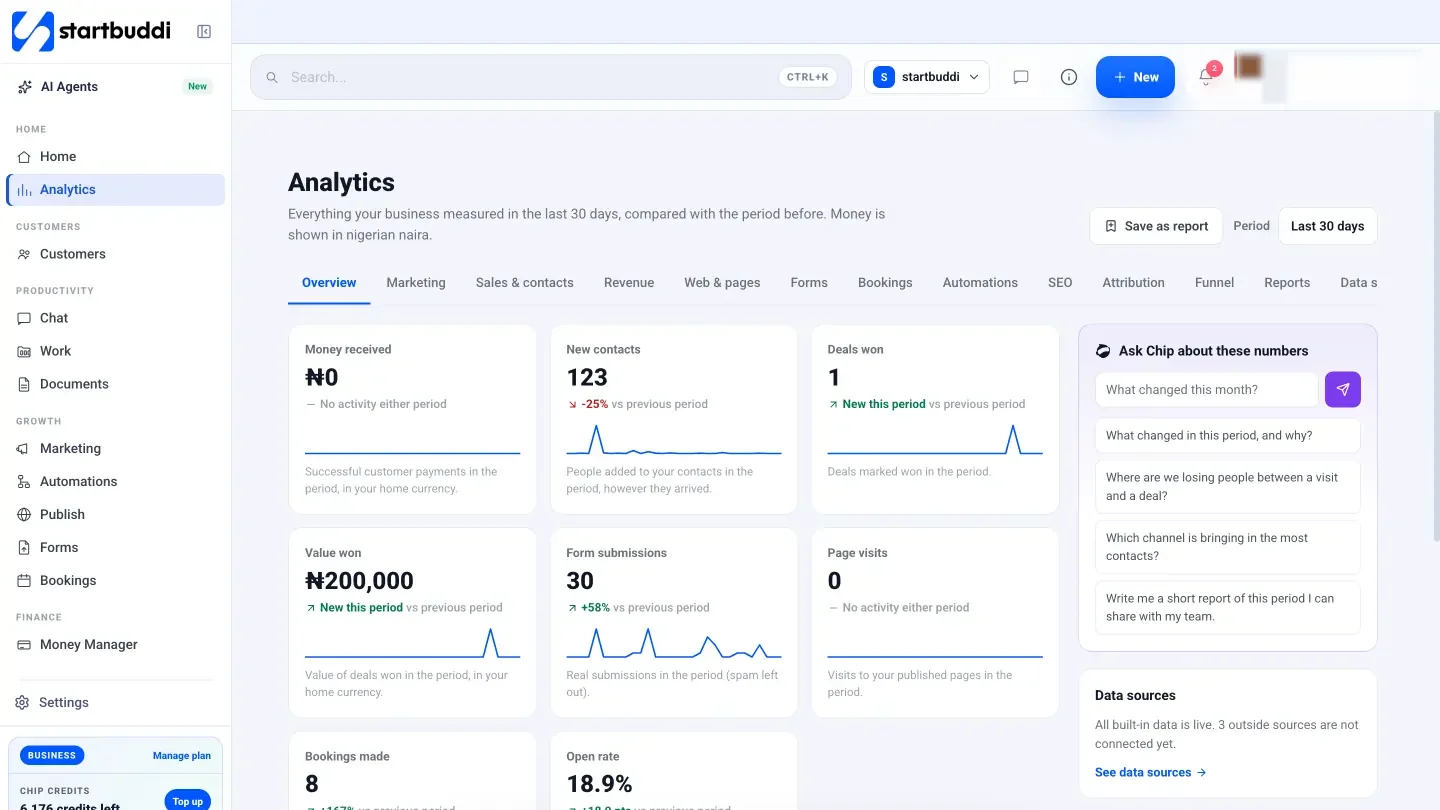
Analytics now has its own spot in the sidebar, and it does proper reports. The numbers that used to sit inside Publish and Marketing have moved into it, and your old links still open the right page.
The biggest change is brands. Give each client a brand with its own data sources, dashboards, reports and goals, and group brands into folders if you look after a lot of them. Team members see only the brands you give them, so the person who looks after one client does not see another client’s figures.
Your startbuddi data is already there: contacts and deals, email, forms, pages, bookings and money. To see your whole website, add one snippet for visitor tracking that does not use cookies, and connect Google Analytics 4, Search Console and Mixpanel.
What you can do
- Start from a ready-made dashboard. Each data source comes with one, or build your own with drag and drop and a filter on each widget. Chip can build a dashboard from a sentence, such as “enquiries and bookings for the last quarter”.
- Make a client report without the copy and paste. Start a report from a template, from a dashboard or from Chip. Chip writes it from your numbers only, and every report waits for your review before it goes anywhere.
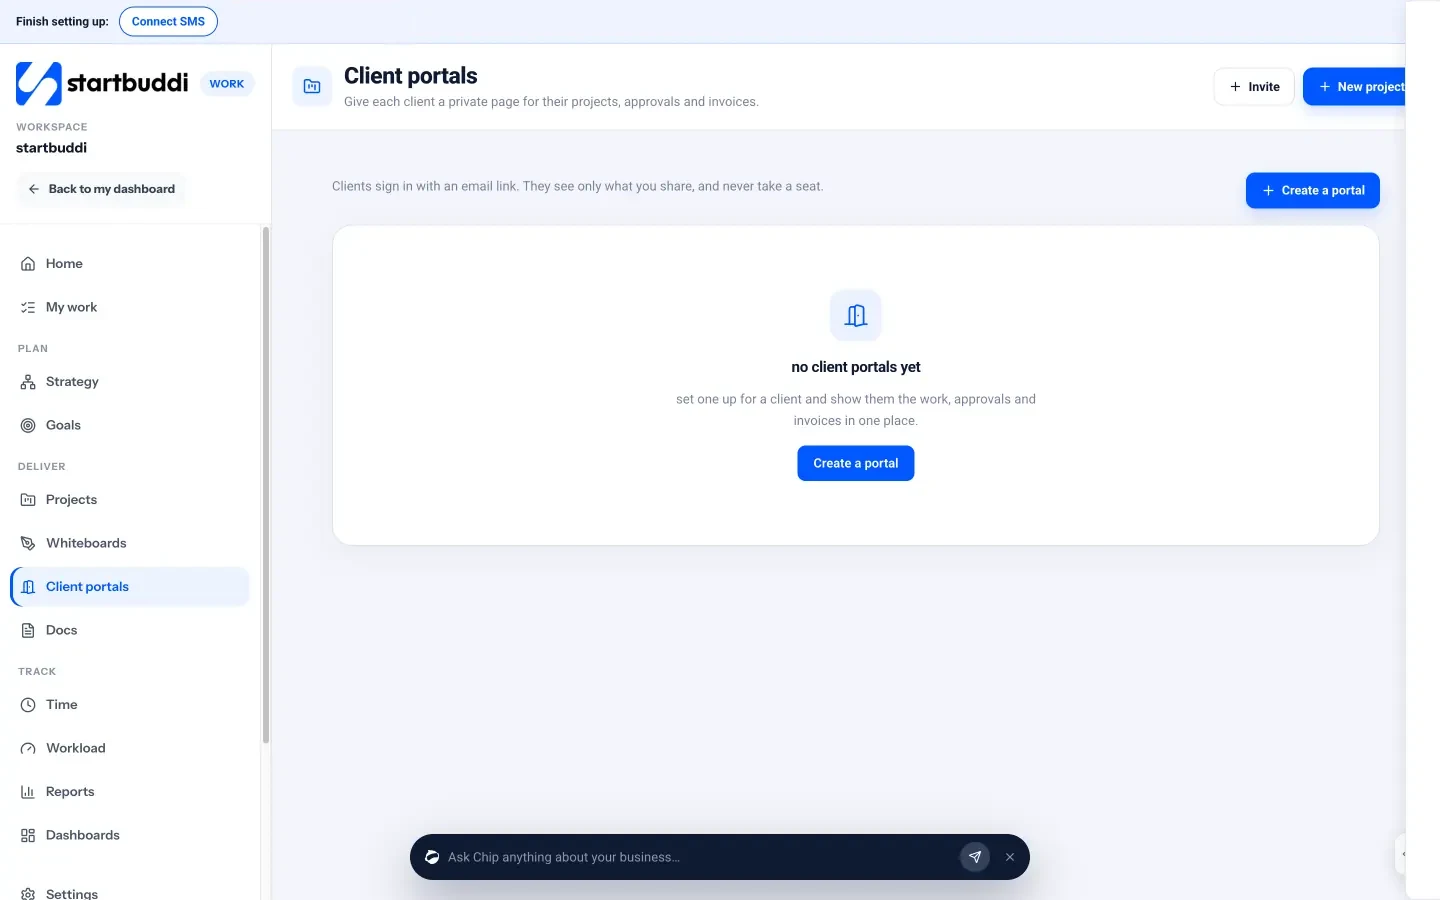
- Send it the way the client wants it. Share a report as a PDF, by email, as a link with a password, or inside the client’s portal, once or on a schedule.
- Set goals on any number. Goals update themselves as the numbers come in, and they can keep Work key results and campaign goals up to date. Every goal sits on one Goals page.
- Hear about it when something changes. Set an alert for when a number crosses a line or something unusual happens, in the app, by email or on WhatsApp, with quiet hours so it does not wake you up.
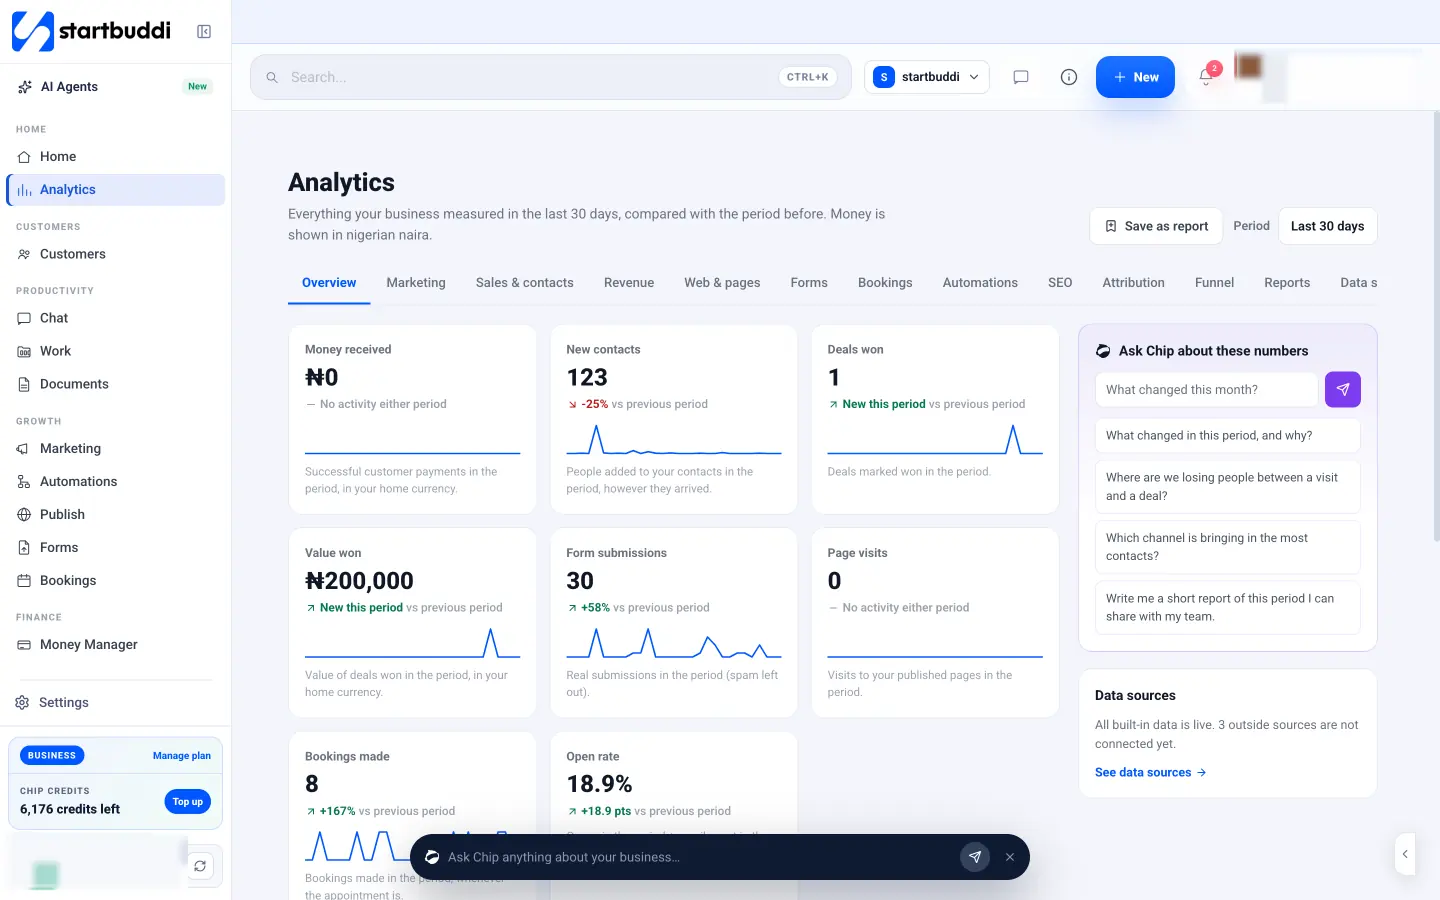
- Ask Chip what changed. The overview has a summary from Chip of what went up and down in the period, and you can ask it why.
A small agency with eight clients might keep a brand for each, connect each client’s Google Analytics and Search Console, and schedule a monthly report into each client’s portal. The report is drafted from that client’s numbers, waits for a check, then goes out on the day. The hours that used to go on screenshots go on talking about what to do next.
Every number in Analytics says where it comes from, such as “Visits (startbuddi)” for visits to the pages you publish in startbuddi. That matters when a client asks why two reports disagree: you can see which source each figure came from.
A note on what is not here yet: advertising data, such as Google Ads, is not one of the sources you can connect today.
For your own business, the same tools work without any brands at all. Open Analytics, pick a period, and every number is compared with the period before it, with Chip there to explain the difference. The Analytics page shows what is included.
See it in action
Try it
Open Analytics from the sidebar. What each plan includes is on the pricing page. New to startbuddi? Make a free account and have a look around.