HR data analytics: Definition, Examples and How It Works

HR data analytics is the practice of collecting, cleaning and analysing the information an employer already holds about its people, such as start dates, leave, attendance, reviews and exits, to answer business questions about hiring, retention and cost.
HR data analytics is the practice of collecting, cleaning and analysing the information an employer already holds about its people, such as start dates, leave, attendance, reviews and exits, to answer business questions about hiring, retention and cost. In a small business it usually means a few reliable formulas run on tidy staff records.
Key takeaways
- HR data analytics starts from records you already keep: staff list, leave, attendance, reviews and leavers.
- Most of the work is cleaning the data. One missing leaving date can make a small team’s turnover look half what it really is.
- Write a short data dictionary so every number is calculated the same way each month.
- HR data is personal data. Collect the minimum, restrict access and tell staff what you use it for.
What is HR data analytics?
HR data analytics turns HR records into answers. “Why do new hires leave?” becomes a calculation on start dates, leaving dates and exit reasons.
It is close to workforce analytics, and the two terms are often used interchangeably. The useful difference: workforce analytics starts from the work (hours, capacity, utilisation), while HR data analytics starts from the HR data itself and the people processes behind it.
Why HR data analytics matters for a small business
Small teams feel every exit: three leavers from a 12-person company is a quarter of its knowledge gone. Without the data, owners guess at the cause. With it, patterns show up quickly: leavers who all joined in the same month, absence that clusters around one manager, or leave that piles up until the busiest season.
How HR data analytics works
- List your HR data sources. Most small businesses already hold the data below, scattered across a spreadsheet, WhatsApp and email.
- Write a one-page data dictionary: each field, where it comes from and who updates it.
- Clean it: fill missing dates, merge duplicate people, use one spelling for each department.
- Calculate a few metrics the same way every month.
- Decide one action, then re-check the same numbers next quarter.
| HR data you hold | Fields to keep | What it answers |
|---|---|---|
| Staff list | Name, role, department, manager, start date, leaving date | Headcount, turnover, tenure |
| Leave records | Type, days taken, days remaining | Leave liability, holiday clashes |
| Attendance | Days scheduled, days absent, reason | Absence rate, patterns by team |
| Reviews | Cycle, completed or not, outcome | Review completion, performance trends |
| Exit notes | Leaving reason, notice given | Why people leave |
Key formulas:
| Metric | Formula |
|---|---|
| Staff turnover | Leavers in the period ÷ average headcount × 100 |
| Early turnover | Leavers within 6 months of joining ÷ all leavers × 100 |
| Absence rate | Days absent ÷ days scheduled × 100 |
| Leave still owed | Total entitlement − days taken, across the team |
HR data analytics example with numbers
An IT managed-services company in Wuse, Abuja (example figures) averaged 14 staff over the last 12 months and had 5 leavers, so turnover is 5 ÷ 14 × 100 = 36%. The owner assumed pay was the problem, but 4 of the 5 leavers left within six months of joining (80% early turnover), and all 4 were help-desk engineers who started without a structured first week. The fix is a written employee onboarding checklist, not a pay rise across the board.
Absence tells a calmer story: 60 days absent out of 3,360 scheduled days (14 people × 240 working days) is an absence rate of 1.8%.
A nine-person bookkeeping firm in Manchester (example figures) gives each person 25 days of paid time off, so 225 days in total. By the end of September only 90 days have been taken, leaving 135 days owed in the last quarter, just before the firm’s January rush. Spread over about 60 working days, that is more than two people away on an average day. The firm asks staff to book half their remaining leave before mid-November.
Keeping HR data clean and legal
HR data is personal data, and some of it, such as health information behind sick leave, is sensitive. In Nigeria, the Nigeria Data Protection Act 2023 applies, overseen by the Nigeria Data Protection Commission. In the UK, the ICO’s employment information guidance covers keeping employment records, monitoring and health data (both checked on 1 October 2026).
In practice: collect only the fields in your data dictionary, limit who can see salary, health and disciplinary records, share numbers by group rather than by person, and archive what you no longer need.
Related terms
- Workforce analytics: the work-focused side of people numbers.
- Paid time off: the entitlement behind leave liability.
- Employee onboarding: where early turnover usually starts.
Each metric becomes a KPI once you set a target. For the bigger picture, see our guide to HR for small business.
How startbuddi handles HR data analytics
In startbuddi, HR data is collected by the People module as part of normal work, so it is already structured when you want numbers:
- each person has one profile with job, department, manager, start date, leave and reviews;
- People > Reports shows active employees, new starters, leavers, attendance for the last 7 days, leave days this month, team by department, team growth, joining and leaving, policy acknowledgements and requests over the last 90 days;
- access follows People permissions, so managers see only their own reports;
- Chip HR, startbuddi’s HR assistant, answers questions such as headcount, turnover and review completion from your own records.
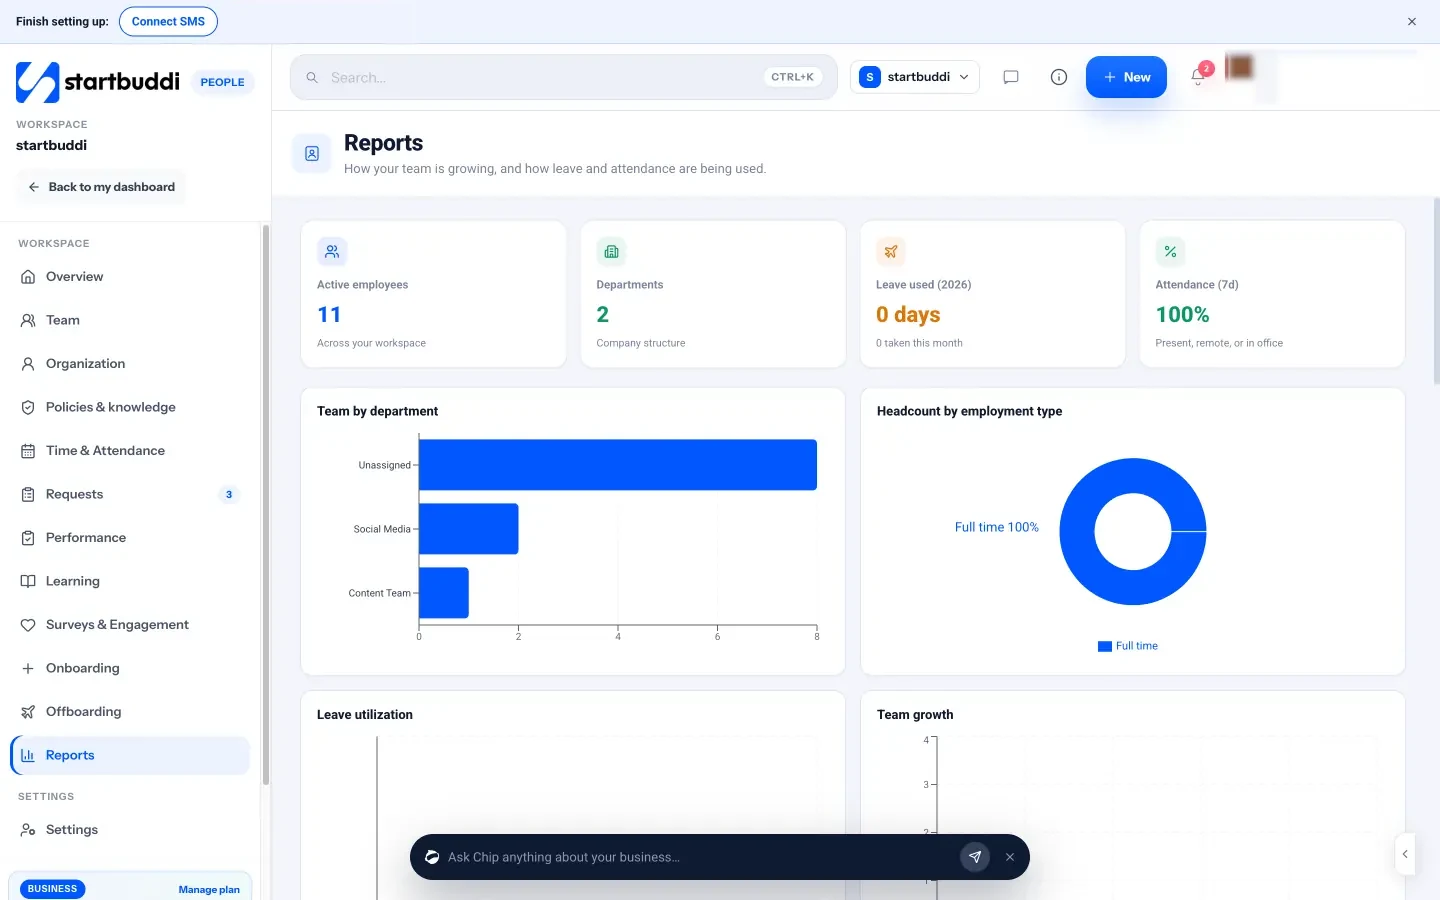
The honest limits: People reports have no export, date-range picker or custom report builder yet, and there is no payroll data because startbuddi does not run payroll.
HR data analytics is part of People in startbuddi.
See PeopleRelated terms
FAQ
What is HR data analytics in simple terms?
It is using the records you already keep about staff, such as start dates, leave, absence and exits, to answer questions about your team. For a small business that usually means a few formulas such as turnover and absence rate, calculated the same way every month.
What HR data should a small business collect for analytics?
Start with a clean staff list (role, department, manager, start and leaving dates), leave taken and remaining, absence days and exit reasons. That covers turnover, absence and leave planning. Add review completion once you run regular reviews.
Is HR data analytics the same as HR analytics?
Mostly, yes. "HR data analytics" puts more weight on collecting and cleaning the data, while "HR analytics" is the broader practice. Both use the same records and formulas.
How do I calculate staff turnover from HR data?
Divide the number of leavers in a period by the average headcount for that period, then multiply by 100. For example, 3 leavers in a year with an average of 12 staff is a 25% annual turnover rate. --- Get your HR data in one place. Read our guide to HR for small business, then start free with startbuddi. A free plan is available; see the pricing page for team seats.
Tiwalade Joanna Okedara-Kalu is the founder, CEO and CTO of startbuddi, the business system that brings clients, bookings, invoices, projects, marketing and the Chip AI assistant into one place. Tiwalade builds software around how service businesses really work day to day, and writes about client management, getting paid on time and why small businesses outgrow the tools they start with.
Founded startbuddi and leads its product and engineering