Workforce analytics: Definition, Examples and How It Works

Workforce analytics is the practice of measuring how your team's time, skills and cost turn into work for customers, then using those numbers to decide who to hire, how to schedule and where effort is wasted.
Workforce analytics is the practice of measuring how your team’s time, skills and cost turn into work for customers, then using those numbers to decide who to hire, how to schedule and where effort is wasted. For a small business it means tracking a handful of numbers, such as hours booked against hours paid, rather than buying an enterprise system.
Key takeaways
- Workforce analytics answers practical questions: do we need to hire, who is overloaded, and where do paid hours go?
- A team of 5 to 50 people needs four or five numbers, not a dashboard of 40.
- For a service business the most useful number is usually utilisation: client hours divided by paid hours.
- Ask a business question first, then pick the data. Collecting data with no question attached is the most common mistake.
What is workforce analytics, in plain terms?
Workforce analytics looks at your team as a whole: how many people you have, what they spend their hours on, what they cost and how that changes over time. The CIPD, the UK professional body for HR, notes in its people analytics factsheet that people analytics, HR analytics and workforce analytics are often used interchangeably (checked on 1 October 2026). In practice, HR analytics tends to start from HR records such as leave and exits, while workforce analytics starts from the work: capacity, scheduling and the cost of delivering a service.
Why workforce analytics matters for a small business
In a small team, one wrong hire, or one person quietly doing the work of two, shows up in your profit within weeks. Workforce analytics helps you hire on evidence rather than the feeling of being busy, spot overload before someone burns out, price jobs on the hours they really take, and cut hidden waste such as travel and idle time.
How workforce analytics works
- Ask one business question, such as “Do we need another engineer, or are we wasting hours?”
- Pick two or three metrics that answer it, defined in writing so everyone calculates them the same way.
- Collect the data you already have: timesheets, rotas, job logs, leave records and payroll totals.
- Change one thing, then check the same numbers four weeks later.
The metrics most small service businesses use:
| Question | Metric | How to calculate it | Where the data lives |
|---|---|---|---|
| Are paid hours turning into client work? | Utilisation rate | Client hours ÷ paid hours × 100 | Timesheets |
| Is anyone overloaded? | Hours per person per week | Total assigned hours ÷ people | Task estimates, rota |
| Are we losing people? | Staff turnover | Leavers in a year ÷ average headcount × 100 | Staff records |
| How much time is lost to absence? | Absence rate | Days absent ÷ days scheduled × 100 | Leave and attendance records |
| Is the team paying for itself? | Revenue per employee | Revenue ÷ average headcount | Accounts, staff records |
Each becomes a KPI once you set a target for it.
Workforce analytics example with real numbers
An IT support company in Ikeja, Lagos (example figures) has 10 field engineers, each paid for 40 hours a week, so 400 paid hours. Clients wait five days for a site visit, and the owner plans to hire two more engineers. One week of job logs shows:
| Item | Hours | Share of paid hours |
|---|---|---|
| Work at client sites | 260 | 65% |
| Travel between sites | 70 | 17.5% |
| Waiting, parts, admin | 70 | 17.5% |
| Total paid | 400 | 100% |
Utilisation is 65%. Travel takes 70 hours because visits are booked in the order clients call, so engineers cross Lagos traffic several times a day. Grouping visits by area (Ikeja and Maryland on Mondays and Thursdays, Victoria Island and Lekki on Tuesdays and Fridays) cuts travel to about 40 hours. That frees 30 hours a week, or ten extra three-hour visits. At ₦40,000 a visit, that is ₦400,000 a week of extra capacity before hiring anyone. He still hires, but one engineer instead of two.
A six-person software support firm in Leeds (example figures) tracks billable hours for each engineer. One bills 34 of 37.5 hours (91%) while two others bill under 60%. The numbers show every urgent ticket going to one person. The fix is a fairer ticket rota, not a new hire.
Workforce analytics tools: what a small team actually needs
You do not need specialist software at the start. You need a reliable source of hours (timesheets or a time tracker), one place for staff records (start dates, leavers, leave and absence), a clear org chart and a monthly habit of reading the same few numbers.
Workforce data is personal data. In Nigeria it falls under the Nigeria Data Protection Act 2023, enforced by the Nigeria Data Protection Commission (checked on 1 October 2026). Collect only what you need and tell staff what you track.
Related terms
- KPI (key performance indicator): the target you set for each metric.
- Billable hours: the hours behind your utilisation rate.
- Org chart: the structure you analyse by team and manager.
For the wider picture, read our guide to HR for small business.
How startbuddi handles workforce analytics
startbuddi keeps the inputs in one workspace:
- Work > Time records hours against tasks, marks what is billable and shows weekly totals for you or the team (time tracking).
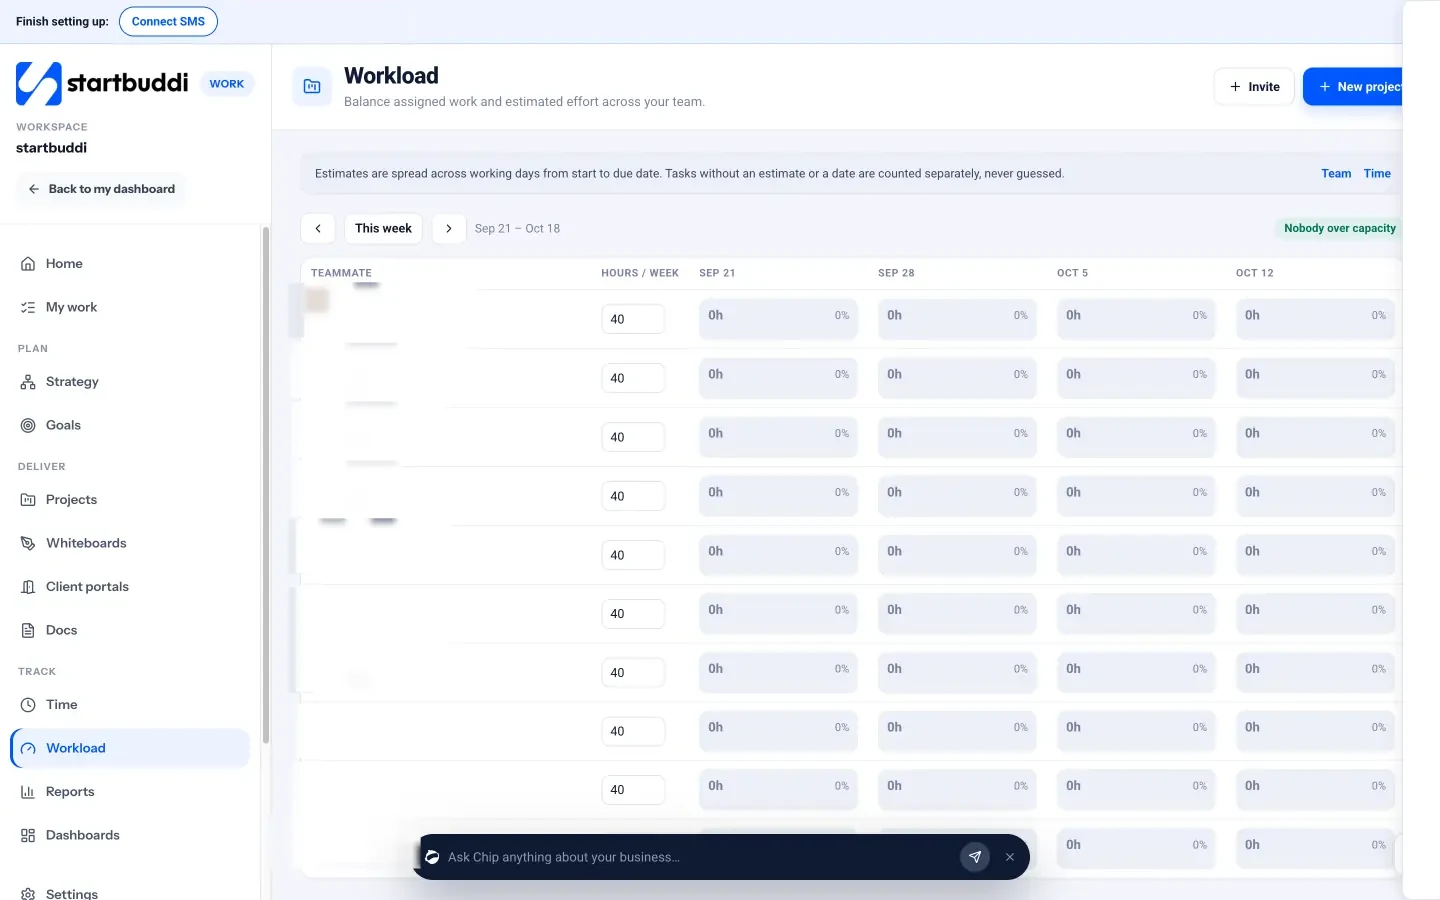
- Work > Workload shows hours per teammate each week and flags anyone over capacity, so you can reassign a task in a click.
- People > Reports shows active employees, new starters, leavers, attendance for the last seven days and leave days this month (People).
- Chip HR, the HR side of startbuddi’s AI assistant Chip, answers questions such as headcount and turnover from your own records.
The limits: People reports have no export, date-range picker or custom report builder yet, and startbuddi does not run payroll.
Workforce analytics is part of People in startbuddi.
See PeopleRelated terms
FAQ
What is the difference between workforce analytics and HR analytics?
They overlap heavily and many people use the terms interchangeably. Workforce analytics usually starts from the work itself, such as capacity, hours and utilisation. HR analytics usually starts from HR records, such as leave, reviews and turnover.
Do small businesses need workforce analytics?
Yes, in a light form. A team of five can track utilisation, hours per person and turnover in a spreadsheet each month. That is enough to make better hiring and scheduling decisions.
What are the most important workforce analytics metrics?
For service businesses, start with utilisation rate, hours per person per week, staff turnover and absence rate. Add revenue per employee once you have a year of data.
How often should I review workforce analytics?
Look at hours and workload weekly, and turnover, absence and revenue per employee monthly or quarterly. Small numbers move a lot, so judge trends over three months, not single weeks. --- See where your team's hours go. Read our guide to HR for small business, then start free with startbuddi. A free plan is available; compare plans on the pricing page.
Tiwalade Joanna Okedara-Kalu is the founder, CEO and CTO of startbuddi, the business system that brings clients, bookings, invoices, projects, marketing and the Chip AI assistant into one place. Tiwalade builds software around how service businesses really work day to day, and writes about client management, getting paid on time and why small businesses outgrow the tools they start with.
Founded startbuddi and leads its product and engineering