
Financial statements for small business: read your numbers with confidence
A plain-English guide to financial statements for small business: the profit and loss, balance sheet and cash flow statement, with worked examples and a monthly review.


This guide explains financial statements for small business owners in plain words: what the profit and loss statement, the balance sheet and the cash flow statement each tell you, how to read them, and how to use them to make better decisions every month. It is written for founders, freelancers and small service businesses who have never had to read a set of accounts, or who nod along when their accountant talks about them.
The short answer: the profit and loss statement shows whether you made money over a period, the balance sheet shows what the business owns and owes on one day, and the cash flow statement shows where cash actually came from and went. Together they answer the three questions every owner asks: are we profitable, are we solid, and can we pay the bills?
Each chapter explains one part with a worked example, common mistakes and what to look for, then shows what startbuddi can give you and what you still need an accountant or accounting software for. By the end you will be able to read your own numbers and spot trouble months before it arrives.
Financial statements for small business: what they are and why they matter
- What financial statements are
- Why a small business needs them
- Do sole traders need all three?
- Who else reads your financial statements
- Statutory accounts versus management accounts
- Cash basis and accrual: two ways to count
- How the three statements connect
- What the statements look like for different businesses
- Financial statements when you apply for a loan
- What to ask your accountant for
- A short vocabulary list
- Common mistakes owners make with financial statements
- How much time this really takes
- Where startbuddi fits
Financial statements sound like something for big companies and stock markets. In fact, they are the simplest way for any business, however small, to see how it is really doing. This chapter explains what the three main statements are, who uses them, and the difference between the formal accounts you may have to file and the everyday reports that help you run the business.
What financial statements are
Financial statements are standard reports that summarise a business's money. There are three core statements, and each looks at the business from a different angle.
| Statement | Also called | What it shows | Time frame |
|---|---|---|---|
| Profit and loss statement | P&L, income statement | Income, costs and the profit or loss left over | A period: a month, quarter or year |
| Balance sheet | Statement of financial position | What the business owns (assets), owes (liabilities) and the owners' stake (equity) | A single date, like a photograph |
| Cash flow statement | Statement of cash flows | Where cash came from and where it went | A period |
The US Securities and Exchange Commission's beginners' guide to financial statements is written for investors, but it is one of the clearest free introductions anywhere. It describes the balance sheet with a single equation, assets equal liabilities plus equity, and the income statement as a staircase: you start at the top with total sales and step down through each cost until you reach profit or loss at the bottom.
Why a small business needs them
You might think your bank balance tells you everything. It does not. A healthy balance can hide a business that is losing money every month but has not yet run out of cash. A low balance can hide a profitable business that is simply waiting for clients to pay. Financial statements separate those stories.
Here is what each one helps you decide:
- Profit and loss: Are my prices right? Which costs are growing? Can I afford to hire? Is this year better than last?
- Balance sheet: How much do customers owe me? How much do I owe? Is the business worth more or less than a year ago? Could it survive a bad quarter?
- Cash flow statement: Why is there less cash than profit? Where did the money go? Am I spending cash on growth, on debt or on day-to-day running?
Cash matters because most small businesses run with very little of it. The JPMorgan Chase Institute found that the median small business holds 27 cash buffer days, enough to cover about 27 days of normal outflows with no money coming in. With a cushion that thin, reading your statements monthly rather than yearly is the difference between spotting a problem and being surprised by it.
Do sole traders need all three?
A freelancer or sole trader with no staff, no stock and no loans can run the business well on a monthly profit and loss, a list of unpaid invoices and a simple cash forecast. A full balance sheet adds little when the only assets are a laptop and money owed by clients. As soon as you take on a loan, hold stock, hire people or form a company, all three statements become worth the effort, and your accountant will usually prepare them for you each year.
Who else reads your financial statements
You are the most important reader, but not the only one.
- Tax authorities use your profit figure to work out tax. Companies usually file accounts with their tax return. See our guide to small business taxes for beginners.
- Company registries in many countries require companies to file annual accounts publicly.
- Banks and lenders ask for statements before a loan or overdraft, and often every year after.
- Investors and partners want to see growth, margins and how cash is used.
- Large clients and landlords sometimes ask for accounts to check you are stable before signing a contract or lease.
- Buyers, if you ever sell the business, will study years of statements.
Statutory accounts versus management accounts
There are two kinds of financial statements, and mixing them up causes confusion.
Statutory (formal) accounts are prepared once a year to meet legal rules. They follow accounting standards, often use the accrual method, and may need to be filed with a registry or tax authority. Companies usually have to produce them; sole traders often do not, though they still report profit for tax. In the UK, for example, very small companies can file simpler accounts: a company counts as a micro-entity if it meets two of three tests, including turnover of £1 million or less, £500,000 or less on its balance sheet and 10 employees or fewer, and can send Companies House only a simplified balance sheet. Many countries allow small companies to use simplified standards, such as the IFRS for SMEs Accounting Standard. Your accountant normally prepares these.
Management accounts are the reports you use to run the business, as often as you like: monthly, weekly or on demand. They do not have to follow any standard. A simple monthly profit and loss built from your invoices and expenses is a management account. So is a list of who owes you money. These are the statements this guide will help you read and use every month.
Cash basis and accrual: two ways to count
Before you read any statement, know which method it uses. The US Small Business Administration explains the difference simply: the accrual method puts transactions on the books immediately, while the cash method records them only once payment has been received.
Say you finish a $5,000 project on 28 March and the client pays on 15 April. On a cash-basis P&L, the $5,000 is April income. On an accrual P&L, it is March income, and at the end of March it sits on the balance sheet as money owed to you. Neither is wrong. Cash basis is simpler and matches your bank; accrual shows the work you did in the month you did it. Just make sure you compare like with like.
How the three statements connect
The statements are not three separate stories. They link together, and understanding the links is what makes them useful.
- The profit at the bottom of the P&L adds to the owners' equity on the balance sheet (unless it is paid out to the owners).
- The cash flow statement starts from profit and adjusts for everything that is not cash yet: invoices not yet paid, bills not yet settled, equipment bought, loans taken or repaid.
- The closing cash on the cash flow statement is the same number as cash on the balance sheet.
So if you have profit but no cash, the cash flow statement tells you why, and the balance sheet shows where the missing cash is sitting (often in unpaid customer invoices).
What the statements look like for different businesses
The same three statements look quite different depending on what you sell. Knowing the typical shape for your kind of business helps you spot what is normal and what is not.
Service businesses (consultants, agencies, designers, trades, salons) usually have high gross margins, because their main cost is time rather than materials. Salaries and contractor costs dominate the P&L. The balance sheet is light: a few computers or tools, and a lot of money owed by customers. Cash problems almost always come from slow-paying clients, so receivables are the number to watch.
Product and retail businesses (shops, online stores, food businesses) have lower gross margins, because every sale carries the cost of the goods. Stock is a big asset on the balance sheet, and cash is often tied up in it. Cash problems usually come from buying too much stock, or buying it too early before a busy season.
Subscription and membership businesses (gyms, software, retainers, memberships) have steady, predictable revenue. Customers often pay in advance, which shows up as a liability until the service is delivered, and can make cash look healthier than profit. The numbers to watch are how many customers renew and how many leave. Our guide to recurring revenue for service businesses goes into this model.
Financial statements when you apply for a loan
Lenders read your statements to answer two questions: can you afford the repayments, and what happens if things go wrong? Before you apply, prepare:
- Profit and loss statements for the last one to three years, plus the year so far.
- A current balance sheet showing what you owe already.
- A cash flow forecast for the next 12 months including the new repayments.
- A short explanation of any unusual year or big swing.
Clean, consistent monthly management accounts make this much easier, because you are not rebuilding a year of numbers under pressure. Some lenders also ask for bank statements to check that your reports match reality, which is another reason to keep business and personal money separate.
What to ask your accountant for
If you have an accountant, ask them for three things beyond the annual return. First, a copy of your formal accounts with ten minutes' explanation of what each statement shows. Second, the two or three numbers they would watch in your business and why. Third, whether your everyday reports (the management accounts) use the same method as the formal ones, so you know how to compare them. Most accountants are happy to explain; very few clients ask.
A short vocabulary list
- Revenue, turnover, sales: money earned from customers, before costs.
- Receivables (debtors): money customers owe you.
- Payables (creditors): money you owe suppliers.
- Depreciation: spreading the cost of equipment over the years you use it.
- Drawings: money a sole trader takes out of the business for personal use.
- Retained earnings: profits kept in the business rather than paid out.
Common mistakes owners make with financial statements
- Only looking once a year. By the time annual accounts arrive, the year is over and it is too late to act.
- Looking only at the bank balance. It mixes up profit, timing, tax money and loans.
- Treating statements as the accountant's job. The accountant prepares them; you run the business with them.
- Mixing personal and business money. Every personal cost in the business account makes the statements less true.
- Comparing different methods or periods. A cash-basis month against an accrual month, or a five-week month against a four-week one, will mislead you.
How much time this really takes
Owners often avoid their numbers because they imagine hours of work. Once your records are kept as you go, reading a monthly P&L, a list of who owes you and a cash forecast takes about 20 to 30 minutes. The first time will take longer, because you are learning what normal looks like for your business. By the third or fourth month, you will spot a change in seconds. That is a small price for knowing, rather than guessing, how your business is doing.
Where startbuddi fits
Money Manager in startbuddi is not accounting software, and it does not produce statutory accounts, a general ledger or a formal balance sheet. What it does is build everyday management reports from the invoices, payments and expenses you already record there, so you can see how the business is doing without waiting for year end.
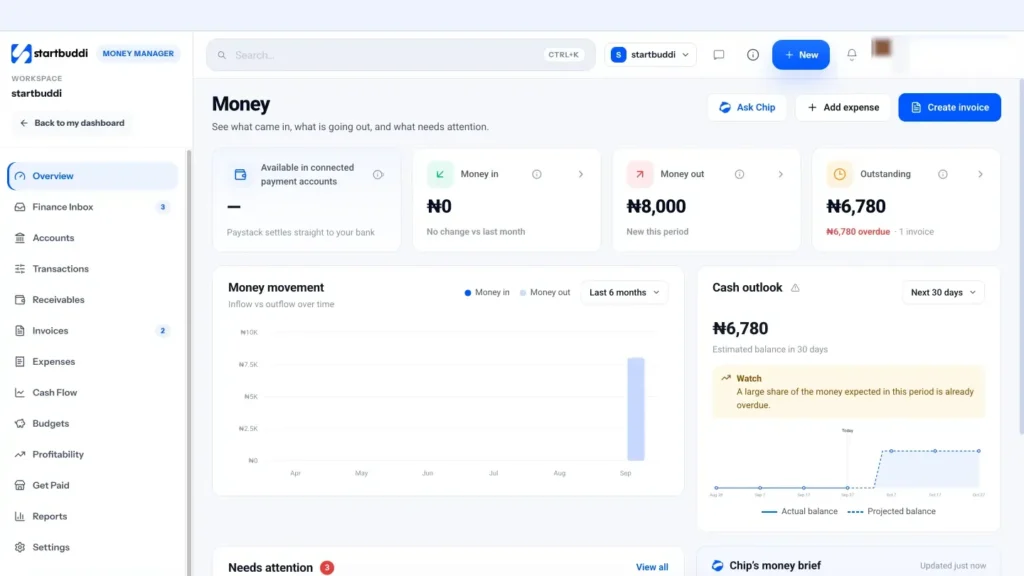
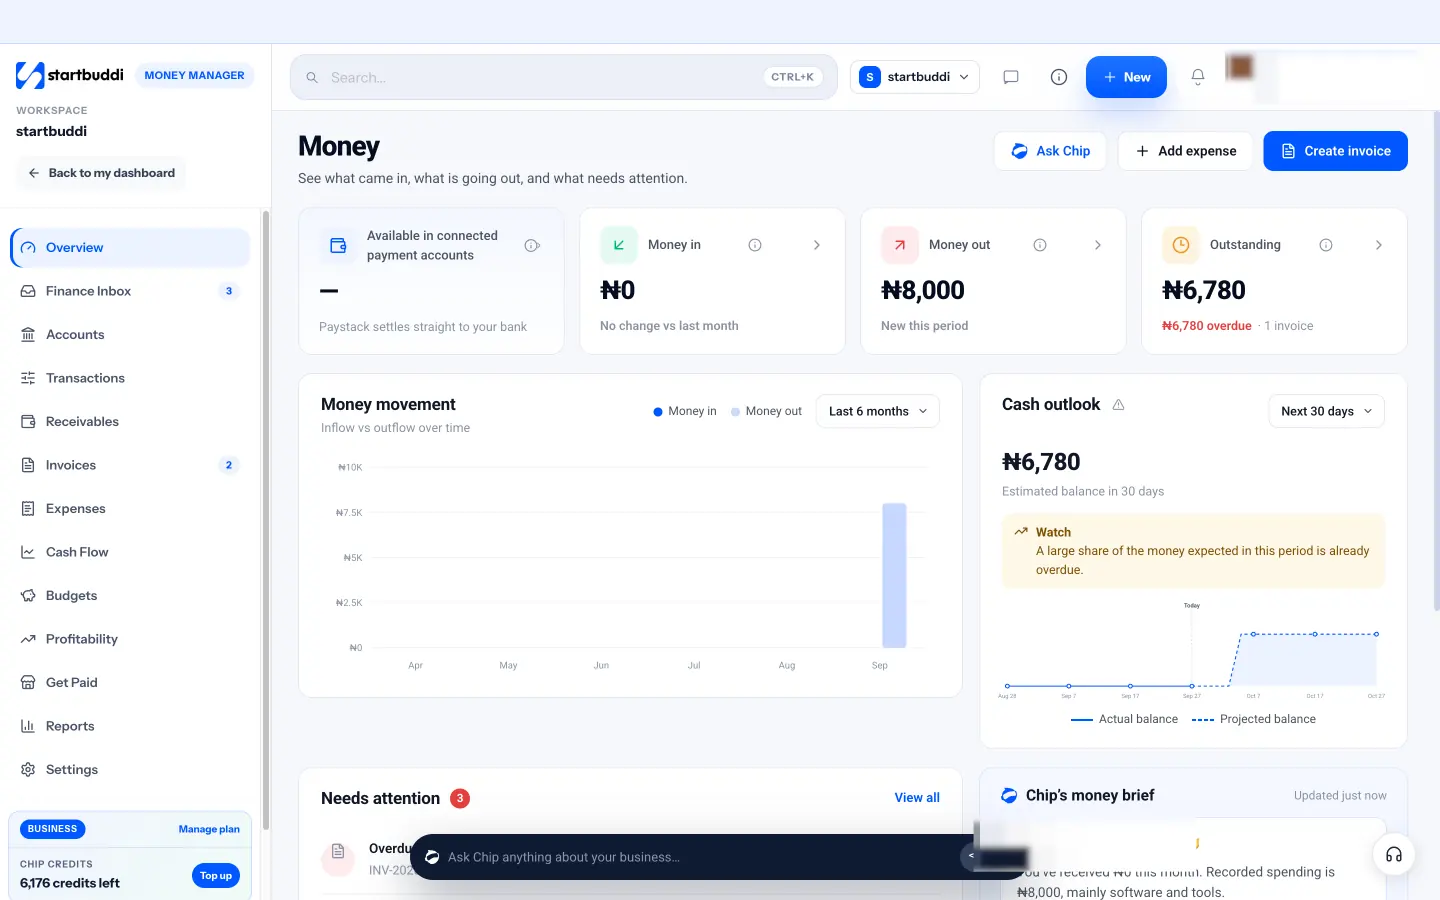
Your money at a glance. The Money Manager overview shows money available in connected payment accounts, money in this month, money out and what is outstanding, with a six-month chart of inflow against outflow and a 30-day cash outlook. It is a quick way to see the three questions of this guide on one screen.
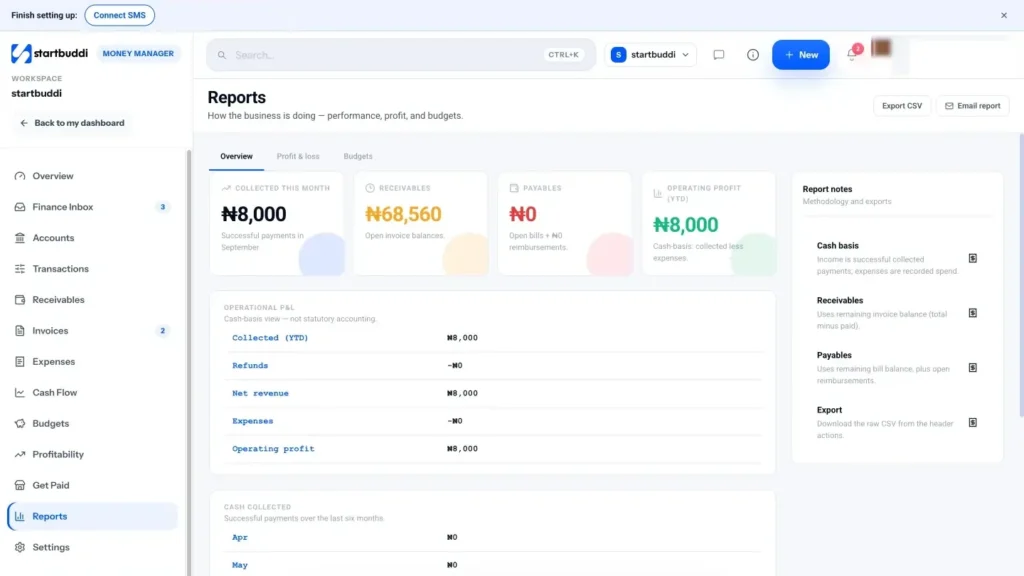
A live profit and loss. Reports gives you an operational P&L built from real data, plus receivables and payables aging and expenses by category. It is labelled as a cash-basis view, not statutory accounting, which is exactly what management accounts should be. Chapter 2 walks through it.
Everything in one feed. Transactions combines payments, expenses, bills and reimbursements, so the numbers behind each report are easy to check. If you are new to this kind of tool, what a money manager app is explains the category, and startbuddi vs QuickBooks Online explains how it differs from accounting software.
The rest of this guide takes each statement in turn, starting with the one you will use most: the profit and loss.
The profit and loss statement: are you making money?
- The layout of a profit and loss statement
- Worked example: a small digital agency's quarterly P&L
- The same quarter on an accrual basis
- How to read a P&L in five minutes
- Margins: the numbers that matter most
- Reading the overheads
- Monthly, quarterly and annual P&Ls
- Reading revenue by source
- Worked example: using the P&L to fix a pricing problem
- The P&L and your break-even point
- Worked example: using the P&L to decide on a hire
- What a healthy P&L trend looks like
- Common P&L mistakes
- Profit and loss in startbuddi
If you only read one financial statement, read the profit and loss. It answers the most basic question in business: did we earn more than we spent? This chapter shows you how a P&L is laid out, how to read it line by line, which numbers to watch, and how to use it to make decisions about pricing, costs and growth.
The layout of a profit and loss statement
Every P&L follows the same staircase, from total sales at the top to profit at the bottom. The names vary a little, but the structure does not.
- Revenue (sales, turnover, income): everything you earned from customers in the period.
- Cost of sales (direct costs): costs that go up and down with each sale, such as materials, freelancers per job, payment processing fees.
- Gross profit: revenue minus cost of sales. How much each sale really contributes.
- Operating expenses (overheads): the costs of running the business whatever you sell: rent, salaries, software, marketing, insurance.
- Operating profit: gross profit minus operating expenses. Whether the business itself makes money.
- Other items: interest on loans, one-off gains or losses.
- Profit before tax, then tax, then net profit: what is left for the owners.
Worked example: a small digital agency's quarterly P&L
Here is a three-month P&L for a four-person digital agency in Austin, Texas, prepared on the cash basis.
| Line | Q2 | % of revenue |
|---|---|---|
| Revenue: website projects | $62,000 | |
| Revenue: monthly retainers | $36,000 | |
| Total revenue | $98,000 | 100% |
| Freelance developers | ($14,000) | 14% |
| Stock assets, plugins and hosting for clients | ($3,500) | 4% |
| Payment processing fees | ($2,500) | 3% |
| Gross profit | $78,000 | 80% |
| Salaries (including owner) | ($48,000) | 49% |
| Office rent | ($6,000) | 6% |
| Software and tools | ($2,400) | 2% |
| Marketing | ($4,000) | 4% |
| Accountant, insurance, other | ($2,600) | 3% |
| Operating profit | $15,000 | 15% |
What does it tell the owner? The gross margin of 80% is healthy for a service business: direct costs are under control. The operating margin of 15% is positive but not huge, and salaries are nearly half of revenue, so one lost retainer would hurt. Retainers are 37% of revenue, which gives some stability. The owner's next questions would be: how does this compare with Q1, and which clients produced the most gross profit?
The same quarter on an accrual basis
Suppose the Austin agency finished a $12,000 website at the end of June but the client paid in July. On the cash basis above, that $12,000 is not in Q2. On an accrual P&L, it would be, and Q2 revenue would be $110,000 with operating profit of about $27,000 instead of $15,000. Same business, same quarter, very different-looking profit. This is why you must know which method a P&L uses before you compare it with anything, and why a cash-basis P&L should always be read alongside a list of unpaid invoices.
How to read a P&L in five minutes
- Look at the bottom line first. Profit or loss? How big, as a percentage of revenue?
- Compare with the same period before. Last month, last quarter, same quarter last year. A number on its own tells you little; a trend tells you a lot.
- Check gross margin. If it is falling, direct costs are rising faster than prices. That is a pricing or scoping problem.
- Scan the overheads for surprises. Any line that jumped? Any subscription you forgot about?
- Look at revenue by source. Which kind of work is growing, which is shrinking, and which is most profitable?
Margins: the numbers that matter most
Gross margin is gross profit divided by revenue. It shows how much of each sale is left to cover overheads and profit. Service businesses often have high gross margins because their main cost is time; product businesses usually have lower ones because they buy stock. Compare your gross margin with your own history more than with other businesses, because it varies so much between industries.
Operating margin is operating profit divided by revenue. It shows how efficiently the business runs overall.
Net margin is net profit after tax divided by revenue. It is what the owners actually keep.
If you want to check the margin on a price before you quote it, our profit margin calculator does the arithmetic.
Reading the overheads
Overheads rarely jump; they creep. A new tool here, a price rise there, a subscription nobody cancelled. Once a quarter, list every overhead line with its figure a year ago and today. Anything that has grown faster than revenue deserves a question: do we still need it, can we pay less, or has it earned its place? In the Austin example, software at 2% of revenue is modest, but if it had doubled in a year while revenue grew 10%, that would be worth a look. Small cuts to overheads go straight to operating profit, because they carry no cost of sales.
Monthly, quarterly and annual P&Ls
Monthly P&Ls are best for running the business: you see problems quickly and can act. But single months can mislead, especially in businesses with lumpy project income or seasonal demand. Quarterly P&Ls smooth out the noise and are better for spotting trends. Annual P&Ls are what tax authorities, lenders and investors usually look at.
Use all three. Look at the month for early warnings, the quarter for real trends, and compare each month with the same month last year to take seasons out of the picture. A catering business will always have a quieter January than December; the question is whether this January is better or worse than last January.
Reading revenue by source
Splitting revenue by where it comes from is one of the most useful things you can do with a P&L. Here is a year for a Lagos photography studio:
| Revenue source | Revenue | Share | Change vs last year |
|---|---|---|---|
| Wedding shoots | ₦9.6m | 48% | +5% |
| Corporate headshots | ₦4.8m | 24% | +40% |
| Studio hire | ₦3.0m | 15% | −10% |
| Photo printing and albums | ₦2.6m | 13% | +2% |
Weddings are still the biggest line, but corporate headshots are growing fastest and, being quick weekday sessions, probably carry a better margin per hour. Studio hire is shrinking. The owner might now put more marketing into corporate work and look at why studio hire is falling. A P&L with one revenue line would have hidden all of this.
Worked example: using the P&L to fix a pricing problem
Wanjiru runs a small catering business in Nairobi. Her monthly P&L shows revenue rising from KES 600,000 to KES 750,000 over six months, but her gross margin has fallen from 45% to 36%. Her operating profit has barely moved.
The P&L told her something was wrong; her records told her what. Food costs had risen, but she had kept her per-head prices the same for a year. Every new event added revenue but less profit than before. She raised prices by 10% for new bookings, kept existing quotes, and within three months her gross margin was back above 42%. Without a monthly P&L, she would have seen only "more sales" and assumed things were fine. Our guide to pricing strategy for small business covers how to raise prices well.
The P&L and your break-even point
Once you have a few months of P&Ls, you can work out your break-even point: the revenue at which you make neither profit nor loss. Divide your monthly operating expenses by your gross margin. For the Austin agency, quarterly operating expenses are $63,000, about $21,000 a month, and gross margin is 80%, so break-even is roughly $21,000 ÷ 0.80 = $26,250 of revenue a month. Anything above that is profit. Knowing this figure makes quiet months far less frightening, and tells you exactly how much new work you need before a new hire pays for itself.
Worked example: using the P&L to decide on a hire
The Austin agency owner wants to hire a junior designer at a total cost of about $4,500 a month, or $13,500 a quarter. Using the Q2 P&L, she asks: how much extra revenue do we need to cover this person?
With an 80% gross margin, every extra dollar of revenue adds 80 cents of gross profit. To cover $13,500 of extra cost, she needs $13,500 ÷ 0.80 = about $16,900 of extra revenue a quarter, or roughly $5,600 a month. If the new designer lets the team take on one more website a month at her average price of about $6,000, the hire pays for itself with a little to spare. If there is no extra work to take on, the hire would cut her operating profit from $15,000 to $1,500 a quarter.
The P&L did not make the decision for her, but it turned a vague worry ("can we afford it?") into one clear question ("can we sell one more website a month?"). That is what financial statements are for.
What a healthy P&L trend looks like
There is no single "good" P&L, but healthy small businesses tend to show a few patterns over time:
- Revenue growing steadily, even if slowly, compared with the same period last year.
- Gross margin stable or improving, which means prices are keeping up with costs.
- Overheads growing slower than revenue, so operating margin widens as the business grows.
- No single customer or service so large that losing it would wipe out profit.
- A share of revenue that repeats every month, from retainers, subscriptions or regular clients.
If your P&L shows the opposite on two or more of these for several months, it is time to look hard at prices, costs or the mix of work you take on.
Common P&L mistakes
- Putting owner's drawings in expenses (or leaving your salary out). For a sole trader, money you take out is not usually a business expense. For a company, your salary is. Be consistent and ask your accountant how to treat it.
- Including loans as income. A loan is money you owe, not revenue. It belongs on the balance sheet.
- Putting equipment purchases straight into expenses in your formal accounts. Big items that last years are usually treated as assets and spread over time. For your own management P&L, just show them clearly as one-off items.
- Counting VAT or sales tax as revenue. Tax you collect for the government is not your income.
- Ignoring small monthly swings. A single bad month is noise. Three bad months in a row is a trend.
Profit and loss in startbuddi
Money Manager's Reports page builds a profit and loss directly from your invoices, payments and expenses, so there is no separate accounting login and nothing to type twice. It is a management P&L on the cash basis, which is what most small businesses need for month-to-month decisions.
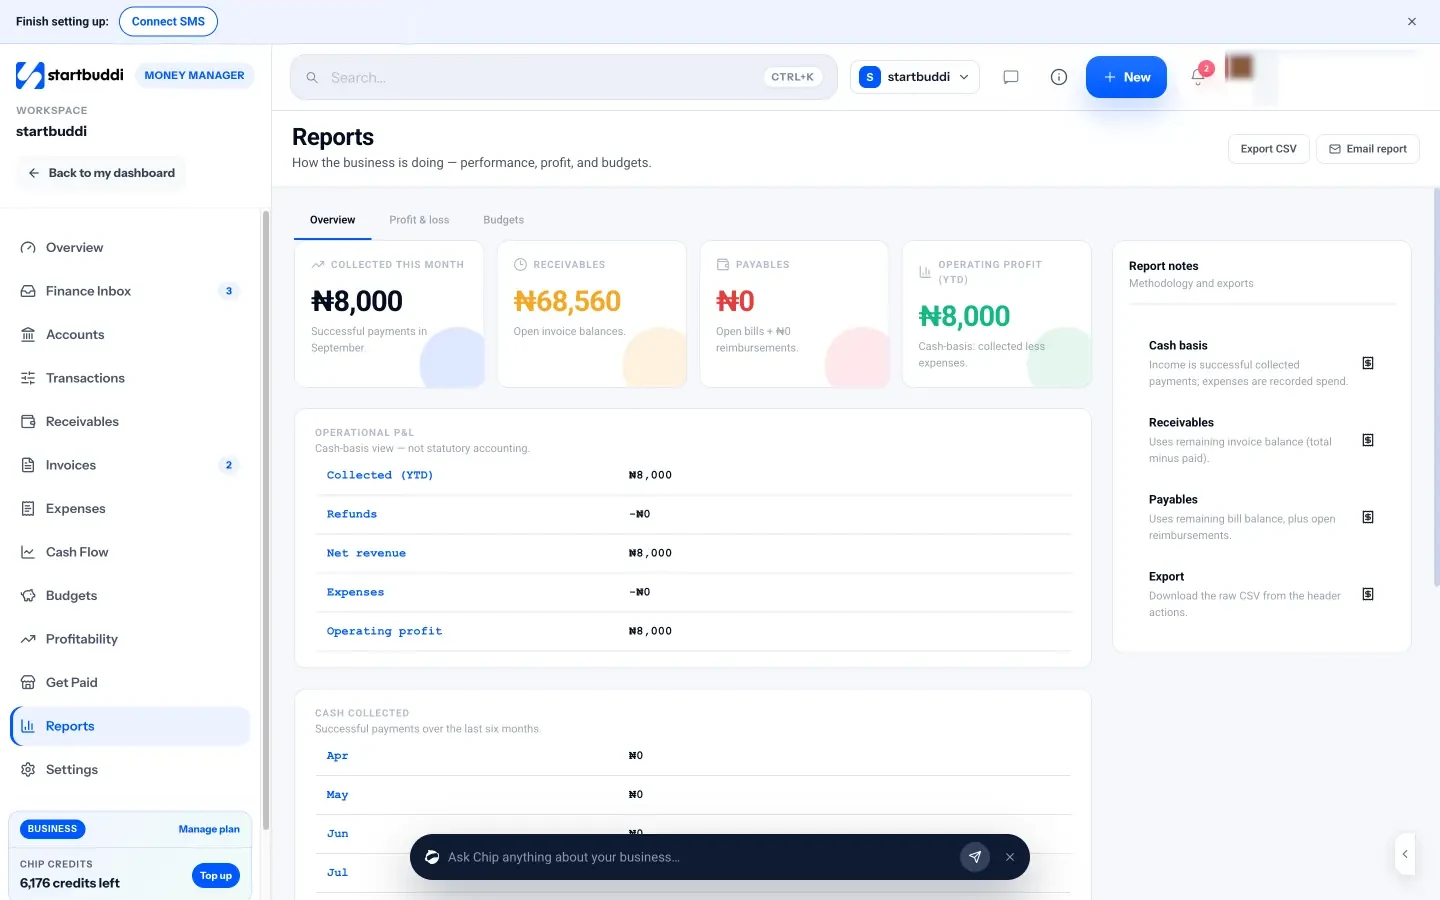
1. Open the overview report. In Money Manager, go to Reports. The Overview tab shows cash collected this month, receivables, payables and operating profit for the year to date, then an operational P&L, cash collected over six months, receivables and payables aging and expenses by category.
2. Switch to Profit & loss for a period. The Profit & loss tab shows revenue, expenses, net profit and tax collected on invoices, for this month, this quarter, this year or year to date. Income is broken down by source: invoices, bookings, pages, forms, the sales point, subscriptions, payment links and more. That breakdown answers the "which kind of work is growing" question straight away. Expenses are broken down by category.
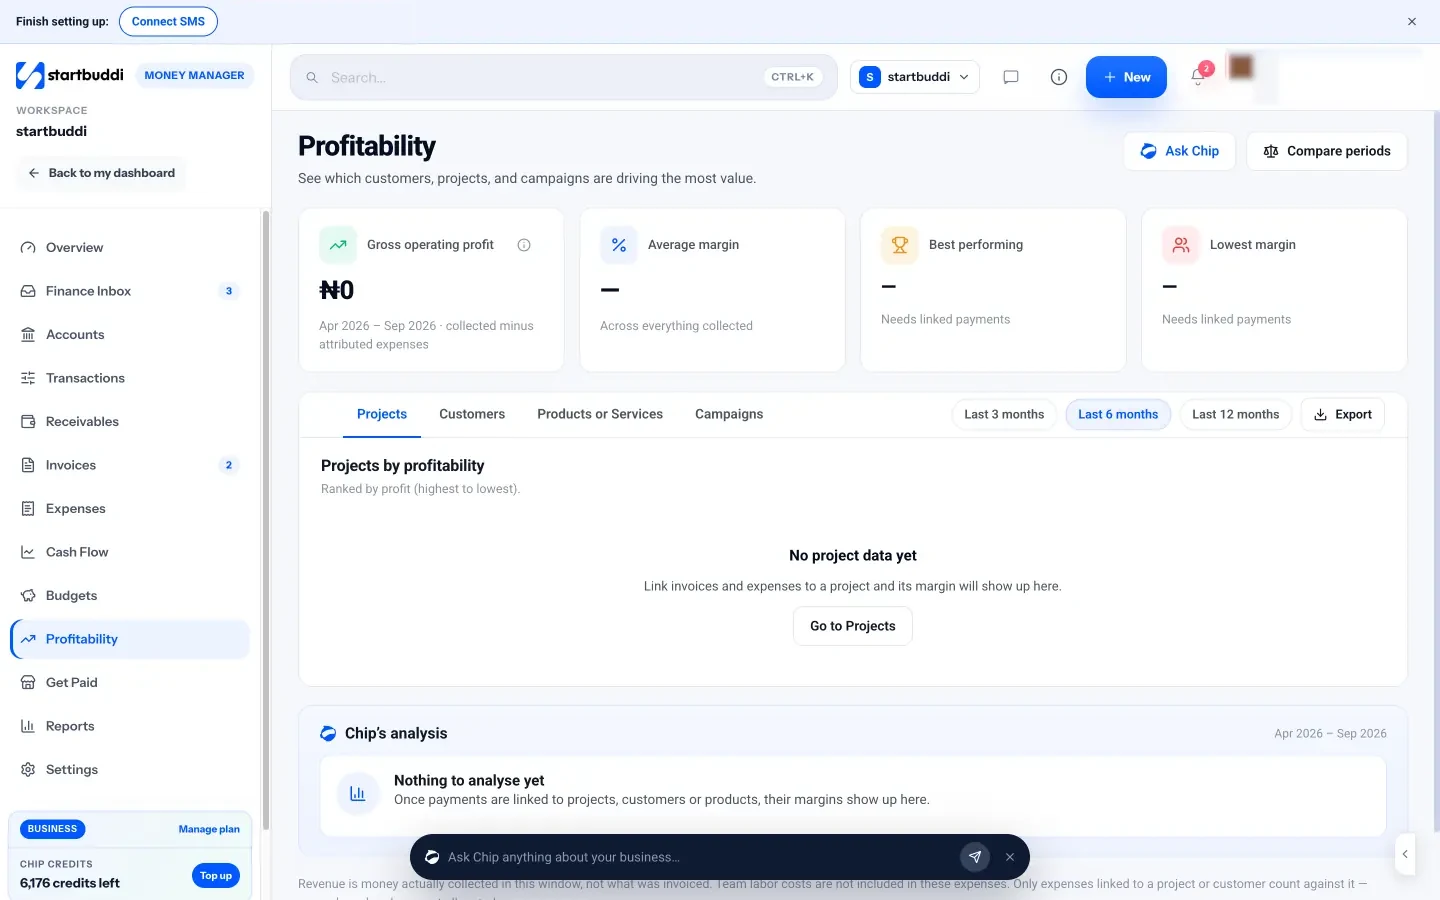
3. See profit by client, project and product. The Profitability page shows revenue collected minus attributed expenses for each project, customer, product or service, and campaign, ranked by profit, with margin. It is the P&L sliced the way owners actually think. Note that it counts recorded expenses, not the value of your team's time.
4. Share it. Use Export CSV for the raw data or Email report to send a report to your inbox, ready to forward to a co-founder or accountant. If you want to go further on this topic, our post on tracking profit and loss covers building a monthly habit.
A reminder of the limits: this P&L reflects what is recorded in startbuddi. Costs paid from a bank account you have not logged, and income received outside startbuddi and not recorded against an invoice, will be missing. Record them and the P&L will be complete.
The balance sheet and cash flow statement
- The balance sheet: a photograph of one day
- Worked example: a small balance sheet
- Reading a receivables aging report
- Customer deposits and prepayments
- Working capital: the money that keeps the business moving
- What to look for on a balance sheet
- The cash flow statement: where the cash went
- Worked example: why profit and cash differ
- If you sell physical products
- Five ways to improve cash flow
- A cash flow statement versus a cash flow forecast
- Common mistakes with the balance sheet and cash flow
- Balance sheet and cash flow numbers in startbuddi
The profit and loss tells you whether you made money over a period. It does not tell you what you own, what you owe, or why your bank balance does not match your profit. For that you need the other two statements: the balance sheet and the cash flow statement. This chapter explains both with worked examples, and shows why a profitable business can still run out of cash.
The balance sheet: a photograph of one day
A balance sheet lists everything the business owns and owes on a single date, usually the last day of a month or year. It always balances, because of the basic accounting equation the SEC's guide puts in capitals: assets = liabilities + shareholders' equity. For a small business, "shareholders' equity" simply means the owners' stake.
Assets are what the business owns or is owed:
- Cash in bank and payment accounts.
- Accounts receivable: money customers owe you for invoices not yet paid.
- Stock or inventory, if you sell goods.
- Prepayments: things you have paid for in advance, such as an annual software plan.
- Equipment, vehicles and property, usually shown at cost minus wear and tear (depreciation).
Liabilities are what the business owes:
- Accounts payable: bills from suppliers you have not paid yet.
- Tax owed: VAT or sales tax collected but not yet paid over, and income or company tax due.
- Loans, overdrafts and credit card balances.
- Deposits from customers for work you have not yet done.
Equity is what is left: the money owners put in, plus profits kept in the business over the years, minus losses and money taken out.
Worked example: a small balance sheet
Here is a simple balance sheet for a two-person interior design studio in Johannesburg on 30 June.
| Assets | R | Liabilities and equity | R |
|---|---|---|---|
| Cash in bank | 85,000 | Supplier bills unpaid | 22,000 |
| Customer invoices unpaid | 140,000 | Tax owed | 35,000 |
| Sample stock and materials | 18,000 | Customer deposits for future work | 40,000 |
| Computers and equipment | 47,000 | Equipment loan | 30,000 |
| Total liabilities | 127,000 | ||
| Owners' equity | 163,000 | ||
| Total assets | 290,000 | Total liabilities and equity | 290,000 |
Two things jump out. First, customers owe the studio R140,000, much more than the R85,000 in the bank. If a big client pays late, cash gets tight quickly. Second, R40,000 of the cash is really customer deposits for work not yet done, and R35,000 is tax owed. The "free" cash is much smaller than the bank balance suggests.
Reading a receivables aging report
For most service businesses, the most important line on the balance sheet is money customers owe you. An aging report breaks that figure down by how long each invoice has been unpaid. Here is one for the Johannesburg studio's R140,000.
| Age of unpaid invoice | Amount (R) | What to do |
|---|---|---|
| Not yet due | 62,000 | Nothing yet; a friendly reminder a few days before the due date |
| 1 to 30 days overdue | 48,000 | Polite reminder and a phone call |
| 31 to 60 days overdue | 22,000 | Firm follow-up; pause new work until paid |
| Over 60 days overdue | 8,000 | Final notice, payment plan, or consider whether it will ever be paid |
The older an invoice gets, the less likely it is to be paid in full, so the aging report tells you where to spend your chasing time. Review it weekly if cash is tight. If invoices over 60 days keep appearing from the same clients, change your terms with them: deposits, shorter terms or payment before delivery.
Customer deposits and prepayments
Deposits confuse many owners. If a client pays you a R40,000 deposit in June for a project you will deliver in August, the cash is in your account, but you have not earned it yet. On a proper balance sheet, it sits as a liability (you owe the client the work, or their money back) until you deliver. On a cash-basis P&L, it may show as June income. Either way, remember that deposit money is committed to future work. Spending it on something else means you may have to fund the project from later income. Deposits are still one of the best tools for cash flow, as our post on cash flow management explains; just keep track of them.
Working capital: the money that keeps the business moving
Working capital is your short-term assets (cash, receivables, stock) minus your short-term liabilities (bills, tax, short-term debt). It is the money available to run the business day to day. For the Johannesburg studio, it is R85,000 + R140,000 + R18,000 minus R22,000 + R35,000 + R40,000, which comes to R146,000.
Positive working capital is good, but look at what it is made of. If most of it is unpaid invoices, it is not money you can spend yet. Growing businesses often need more working capital, because they take on more work and wait longer for more invoices to be paid. That is why fast growth can cause cash problems even when every project is profitable.
What to look for on a balance sheet
- Can you pay what is due soon? Compare assets you can turn into cash within a year (cash, receivables, stock) with liabilities due within a year (bills, tax, short-term debt). The ratio of the two is called the current ratio. Above 1 means you have more coming in than going out in the short term.
- How much is tied up in unpaid invoices? If receivables grow faster than sales, customers are paying more slowly.
- How much do you owe? Debt is not bad in itself, but it should be growing slower than the business.
- Is equity growing? Rising equity over time means the business is building value. Falling equity means losses or large withdrawals.
The cash flow statement: where the cash went
The cash flow statement follows cash, not profit. It starts with the cash you had at the beginning of the period, shows every source and use of cash, and ends with the cash you had at the end. The SEC's guide describes three sections, and every cash flow statement uses them.
- Operating activities: cash from running the business. It starts with profit and adjusts for timing: subtract the increase in unpaid customer invoices (you booked the sale but did not get the cash), add the increase in unpaid bills (you booked the cost but kept the cash), and so on.
- Investing activities: cash spent on or received from long-term assets, such as buying a laptop, a vehicle or equipment, or selling old ones.
- Financing activities: cash from loans, owners putting money in, loan repayments and owners taking money out.
Worked example: why profit and cash differ
The Johannesburg studio made R120,000 of profit in the first half of the year. Yet its bank balance went up by only R25,000. The cash flow statement shows why.
| Line | R |
|---|---|
| Profit for the half year | 120,000 |
| Customers owe more than at the start (cash not yet received) | (60,000) |
| Owe suppliers more than at the start (cash not yet paid) | 8,000 |
| Add back wear and tear on equipment (a cost, but not cash) | 7,000 |
| Cash from operating activities | 75,000 |
| Bought new computers | (25,000) |
| Cash used in investing activities | (25,000) |
| Repaid part of the equipment loan | (10,000) |
| Owners' drawings | (15,000) |
| Cash used in financing activities | (25,000) |
| Increase in cash | 25,000 |
Nothing is wrong with the business, but the statement makes the owner's priority obvious: collect the R60,000 of extra unpaid invoices. That single change would nearly treble the cash the business generated.
If you sell physical products
Stock changes the picture. Money spent on stock leaves your bank account when you buy it, but only becomes a cost in your P&L when you sell the goods. Until then, it sits on the balance sheet as an asset. A shop that buys a large delivery of stock before a busy season can look very profitable on paper while its bank balance falls sharply. The cash flow statement shows this as an increase in stock reducing cash from operations.
If you hold stock, watch how long items sit on the shelf before they sell. Slow-moving stock ties up cash and may end up sold at a discount or thrown away. Buying smaller amounts more often, even at a slightly higher unit price, can be the better deal for a business with a thin cash buffer.
Five ways to improve cash flow
If your cash flow statement shows cash lagging behind profit, these five levers work for almost every small business.
- Get paid sooner. Invoice on the day work is done, shorten payment terms, and send reminders before and after the due date.
- Ask for deposits. A deposit at the start of each project or booking means you are never funding a whole job yourself.
- Make paying easy. A payment link or card option on the invoice removes excuses and delays.
- Pay suppliers on time, not early. Use the full terms your suppliers give you, unless there is a discount for paying early.
- Spread big purchases. Instalments or a small equipment loan protect your buffer when you buy something that lasts years.
Our guide on sending your first invoice covers the first three in detail.
A cash flow statement versus a cash flow forecast
The cash flow statement looks back: it explains what happened. A cash flow forecast looks forward: it predicts your balance over the coming weeks or months from invoices due, bills due and planned spending. You need both. The statement teaches you where cash leaks; the forecast warns you before you run short. Our post on cash flow management covers forecasting in depth, and how to create a business budget shows how the forecast fits alongside your budget.
Common mistakes with the balance sheet and cash flow
- Forgetting money you owe. Unpaid bills and tax collected are easy to forget because they are not in your face every day.
- Counting all cash as yours. Customer deposits and tax collected belong, in effect, to someone else.
- Letting receivables grow unchecked. A growing pile of unpaid invoices is the most common cash problem in service businesses.
- Funding equipment from day-to-day cash when a small loan or instalment plan would protect your buffer.
- Taking drawings based on profit rather than cash. Pay yourself from cash that has actually arrived.
Balance sheet and cash flow numbers in startbuddi
Be clear on this: startbuddi does not produce a formal balance sheet or cash flow statement. It does not keep a general ledger, track fixed assets or depreciation, or connect to bank feeds. For those, you need an accountant or accounting software. What it gives you are the live figures that matter most for a small business's short-term health, the ones that sit at the heart of both statements.
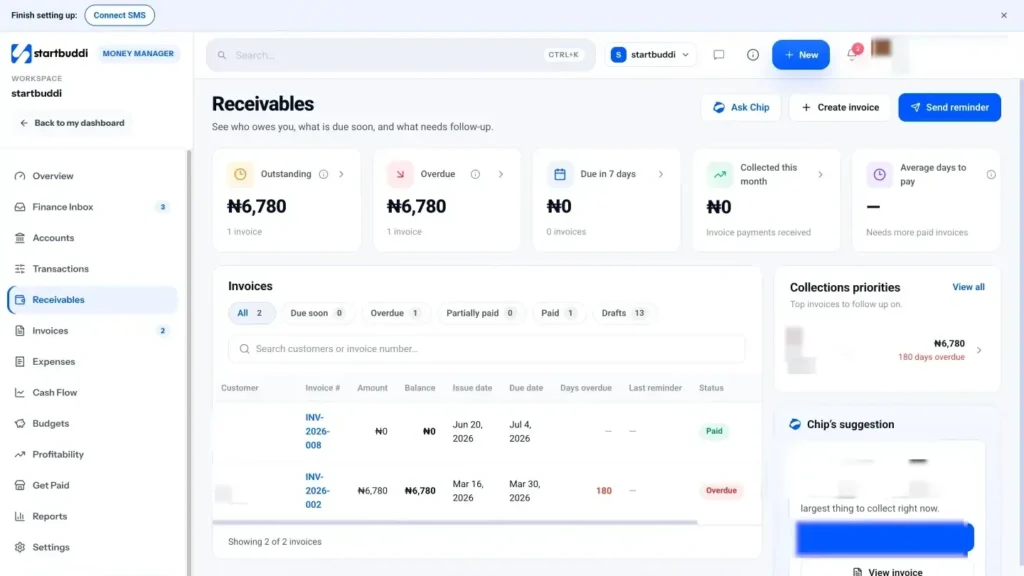
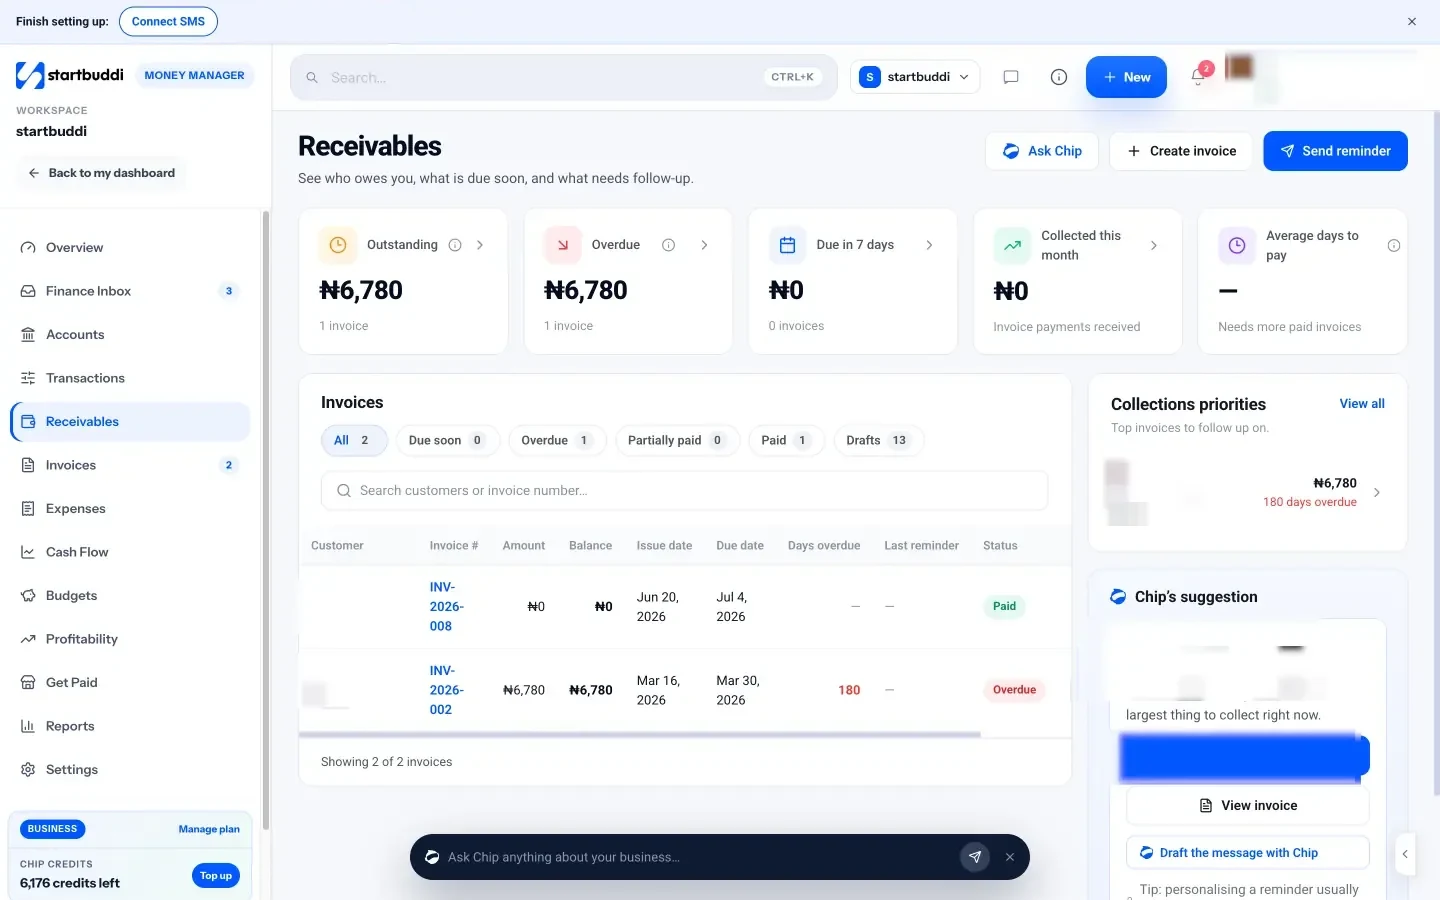
Money owed to you (receivables). The Receivables page shows what is outstanding, what is overdue, what is due in the next 7 days, what you collected this month and your average days to pay, with tabs for due soon, overdue, partially paid and paid. Each open invoice has a one-click Remind button, and the collections priorities list shows which to chase first.
Money you owe (payables). In Expenses, the Bills tab tracks bills from vendors with open, outstanding, overdue and paid totals, approval statuses and partial payments. The Reports overview also shows receivables and payables aging, so you can see how old your unpaid invoices and bills are.
Where cash is heading. The Cash Flow page shows your current known balance, expected inflow and expected outflow, and a balance forecast built from open invoices, subscription renewals, recurring expenses and bills. Every input is listed, and you can run scenarios (for example "overdue invoices paid this week") to see the effect before you act.
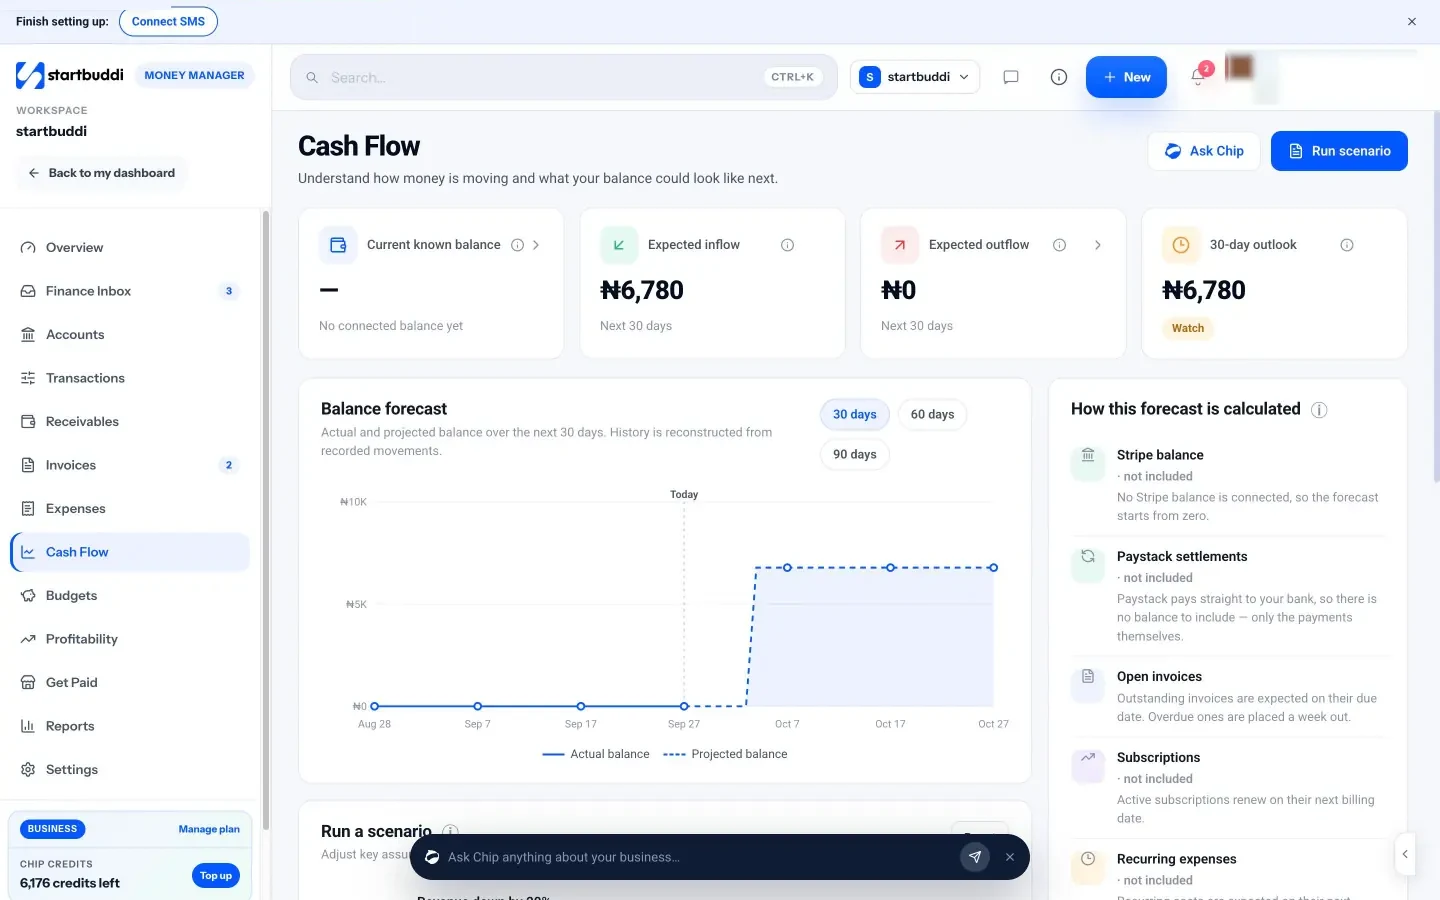
Two limits to keep in mind: the forecast uses your connected Stripe balance plus your records, not your bank balance, and the page shows "Not enough history for a forecast yet" for new accounts. The cash flow, budgets and profitability product page has the full detail.
Key numbers, monthly reviews and data analytics tools for small business
- Eight numbers every small business owner should know
- Worked example: reading the numbers together
- A monthly numbers review in 30 minutes
- Warning signs to act on
- Setting targets from your statements
- Preparing for a meeting with a lender or investor
- Data analytics tools for small business: what you actually need
- How to choose analytics tools
- A one-page monthly numbers pack
- Sharing numbers with your team
- Numbers beyond money
- Common mistakes with business numbers
- Reading your numbers in startbuddi
- Your next step
Financial statements are only useful if they change what you do. This chapter turns the three statements into a short list of numbers to watch, a monthly review routine, and a practical way to choose data analytics tools for small business, so you spend minutes a month on your numbers, not hours.
Eight numbers every small business owner should know
You do not need dozens of ratios. These eight cover profitability, stability and cash, and each comes straight from the statements in chapters 2 and 3.
| Number | How to work it out | What it tells you |
|---|---|---|
| Revenue growth | This period's revenue vs the same period last year, as a % | Is the business growing? |
| Gross margin | Gross profit ÷ revenue | Are prices covering direct costs? |
| Operating margin | Operating profit ÷ revenue | Is the business efficient overall? |
| Break-even revenue | Monthly overheads ÷ gross margin | The minimum you must sell each month |
| Average days to get paid | How long, on average, invoices take to be paid | Are customers paying faster or slower? |
| Current ratio | Short-term assets ÷ short-term liabilities | Can you pay what is due in the next year? |
| Cash runway | Available cash ÷ average monthly cash outflow | How long could you last if sales stopped? |
| Revenue from your biggest customer | Their revenue ÷ total revenue | How exposed are you to losing one client? |
Write these eight on one page and update them monthly. Over time the trend in each matters far more than any single value.
Worked example: reading the numbers together
Chidi runs a software training company in Abuja. His monthly numbers look like this over three months:
| Number | July | August | September |
|---|---|---|---|
| Revenue | ₦4.2m | ₦4.6m | ₦5.1m |
| Gross margin | 68% | 67% | 66% |
| Average days to get paid | 18 | 26 | 34 |
| Cash runway | 3.1 months | 2.6 months | 2.2 months |
| Biggest customer share | 22% | 31% | 38% |
Revenue is rising, which feels like good news. But the other numbers tell a different story. One corporate client now makes up 38% of revenue and is paying slower each month, so cash runway is shrinking even as sales grow. Chidi's actions: agree a deposit and firmer payment terms with the big client, set up reminders on overdue invoices, and put more effort into winning smaller clients to spread the risk. Revenue alone would have told him none of this.
A monthly numbers review in 30 minutes
- Close the month (10 minutes). Make sure every invoice, payment and expense is recorded and categorised, and payments are matched to invoices.
- Read the P&L (5 minutes). Bottom line, gross margin, any overhead surprises, revenue by source.
- Check who owes and who is owed (5 minutes). Receivables by age, bills due, tax to set aside.
- Look ahead (5 minutes). Cash forecast for the next 30 to 90 days.
- Update your eight numbers and pick one action (5 minutes). Chase an invoice, raise a price, cut a cost, delay a purchase.
Once a quarter, compare against your budget and the same quarter last year. Once a year, sit down with your accountant and the formal statements, and ask them to explain anything you do not understand.
Warning signs to act on
Some patterns in your numbers need attention straight away, before they become a crisis. If you see any of these for two months in a row, stop and act.
- Cash runway below two months and falling.
- Average days to get paid rising by a week or more.
- Gross margin falling while revenue rises, which usually means underpricing new work.
- One customer above a third of revenue. Losing them would hurt badly.
- Bills or tax paid late, or paid from money set aside for something else.
- Owner's drawings above profit, meaning you are slowly emptying the business.
Setting targets from your statements
Once you know your numbers, turn them into two or three simple targets for the next quarter. Base them on what you have actually achieved, not on hope. If gross margin has been 62% for a year, a target of 65% through a price rise is realistic; a target of 80% is not. If average days to get paid is 34, aim for 25 by adding deposits and reminders. Write the targets next to your eight numbers and check them each month. Our guide to creating a business budget shows how to turn these targets into a plan.
Preparing for a meeting with a lender or investor
If you are raising money, your statements will be read closely. Before the meeting, make sure you can explain in a sentence or two: why revenue rose or fell each year, what your gross margin is and why, how much you owe and to whom, how long your cash would last, and what the new money is for and how it will be repaid or grow the business. Owners who know their own numbers make a far stronger impression than those who hand over the accountant's file and hope.
Data analytics tools for small business: what you actually need
"Analytics" can mean anything from a spreadsheet to a data warehouse. For most small businesses, the goal is simple: see the numbers that matter in one place, without copying them between tools every month. Here is how to think about the options.
- Spreadsheets. Flexible and free or cheap, and fine for a very small business. The cost is your time: every month you export, paste and rebuild charts, and errors creep in.
- Reports inside your accounting software. Strong for formal financial statements and tax. Usually limited to money, so marketing, sales and operations numbers live elsewhere.
- Business intelligence (BI) and dashboard tools. Connect many data sources and build custom dashboards. Very capable, but setting up and maintaining the connections often needs technical help.
- All-in-one business apps with built-in analytics. If your invoices, clients, bookings and marketing already live in one app, its reports can show money alongside the activity that produced it, with no connections to build.
How to choose analytics tools
- Start from your questions, not the tool. Write down the five questions you want answered every month. Choose the simplest tool that answers them.
- Count the data sources. The more separate systems you use, the more work any analytics tool will need to pull them together.
- Check who will maintain it. A dashboard that breaks when a connection expires, with nobody to fix it, is worse than a spreadsheet.
- Prefer plain language. Tools that show "money received" and "compared with last month" get used; tools full of jargon do not.
- Make sure it is honest about gaps. Know what each number includes and excludes, so you do not make decisions on half the data.
A practical test: before you commit to any tool, try to answer your five questions with it for last month's figures. If it takes more than an hour to set up and still cannot answer them, it is the wrong tool for now. If it answers three of the five in minutes, it may be enough, with a spreadsheet covering the rest. You can always add more capable tools later, when the business and the questions grow.
A one-page monthly numbers pack
If you share numbers with a co-founder, investor, board or accountant, a consistent one-page pack saves everyone time. Keep the same layout every month so changes stand out.
- Headline: two or three sentences on how the month went and why.
- P&L summary: revenue, gross profit, operating profit, with last month and the same month last year beside them.
- Revenue by source: the three to five main lines.
- Cash: balance at month end, expected inflows and outflows for the next 30 days, runway.
- Who owes us: total receivables and the amount over 30 days old.
- The eight numbers: from the table at the start of this chapter.
- Actions: what you decided last month, whether you did it, and what you will do next.
Writing the headline yourself is the important part. It forces you to explain the numbers in plain words, which is when you really understand them.
Sharing numbers with your team
You do not have to share every figure with everyone, but teams that see some numbers make better decisions. A project lead who can see a project's budget and margin will scope work more carefully. A salesperson who sees average days to get paid will think twice before agreeing to 60-day terms. Choose the two or three numbers each person can influence, share them regularly, and explain what good looks like. Most people want to help the business do well; they just need to know what "well" means in numbers.
Numbers beyond money
Financial statements tell you what happened to money. They do not tell you why. The why usually lives in other numbers: how many enquiries came in, how many turned into clients, how many bookings were no-shows, how many customers came back. When revenue drops, the cause is often visible earlier in these activity numbers. A fall in enquiries in March shows up as a fall in revenue in May. Watching a few of them alongside your statements gives you an earlier warning than the P&L alone ever can.
Common mistakes with business numbers
- Too many metrics. Twenty numbers on a dashboard means none of them gets attention.
- Vanity numbers. Followers and page views feel good but do not pay bills. Tie numbers back to revenue, margin and cash.
- No comparison. Always compare with the previous period and the same period last year.
- Reviewing without acting. Every review should end with at least one decision.
Reading your numbers in startbuddi
Because startbuddi puts money, customers and marketing numbers in one app, you can read them together without building connections.
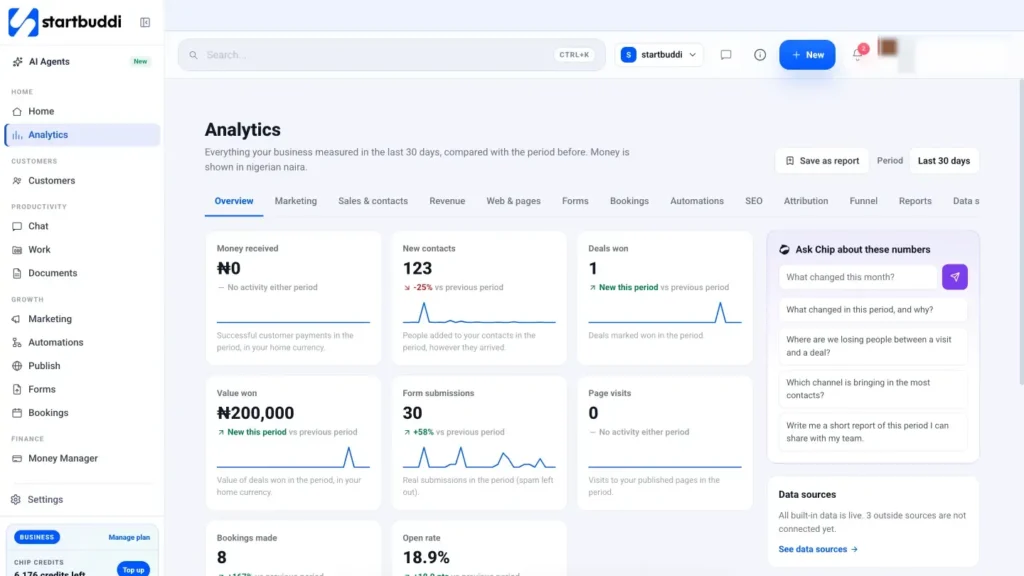
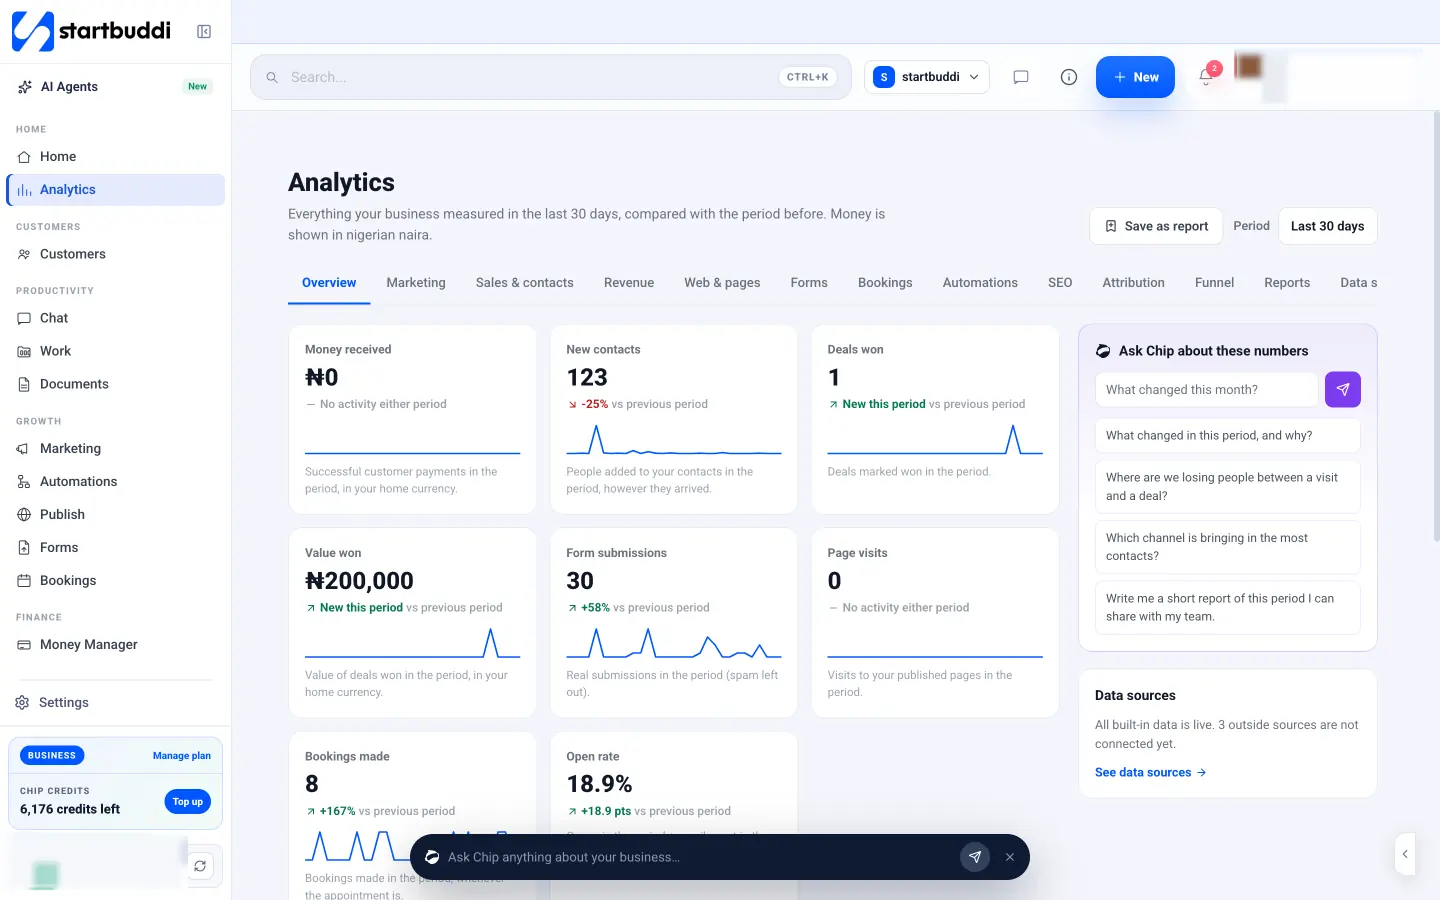
The Analytics hub. Under Home, Analytics brings every number the business produces into one place, compared with the period before. The Revenue tab shows money received, invoices paid, invoices sent and money going out. Other tabs cover marketing, sales and contacts, forms, bookings, web pages and SEO, and the Funnel and Attribution tabs show where new contacts and won deals came from. You can choose periods from the last 7 days to this year, and each card shows the change against the previous period in plain words. Money is counted in your home currency only, and nothing is estimated.
Saved reports. In Analytics, the Reports tab lets you build a saved report (a set of numbers you check again and again), or click Ask Chip for one to have Chip put one together. Nothing is saved until you click Save. Reports can be printed or saved as PDF, which makes a monthly numbers pack easy to share with a co-founder, investor or accountant.
Ask Chip about the numbers. "Ask Chip about these numbers" offers starter questions such as "What changed in this period, and why?" and "Write me a short report of this period I can share with my team." Chip answers from the numbers on screen and says which ones it used. In Money Manager, Chip can also explain your cash forecast or suggest what to cut. Use it to speed up the review, then make the decision yourself. Good questions are specific: "Why did money received fall compared with last month?" works better than "How are we doing?", and "Which customers have invoices more than 30 days overdue?" gets you a list you can act on.
Money detail when you need it. From Analytics, the finance reports link takes you back into Money Manager's Reports, Receivables, Cash Flow and Profitability pages for the detail behind each number. If you track project delivery too, Work dashboards and reports show the operational side.
And the limits one last time: startbuddi gives you management reports built from your own records. It is not a substitute for statutory accounts, a general ledger or an accountant's review. For a comparison of tools in this space, see our list of the best money managers for small business.
Your next step
Take the eight numbers from the start of this chapter and fill them in for last month, even roughly. Then book 30 minutes on the first working day of next month to do it again. If you want most of those numbers to fill themselves in from your invoices, payments and expenses, you can start on the Free plan or try any paid plan free for 30 days from the pricing page.
Tiwalade Joanna Okedara-Kalu is the founder, CEO and CTO of startbuddi, the business system that brings clients, bookings, invoices, projects, marketing and the Chip AI assistant into one place. Tiwalade builds software around how service businesses really work day to day, and writes about client management, getting paid on time and why small businesses outgrow the tools they start with.
Founded startbuddi and leads its product and engineering